Create AI-based charts or tables
You can ask Companion to analyze your process data, such as "What are the most common activities?" or "What is the average number of activities per case?". Companion creates an appropriate chart or table based on the criteria that you want to analyze and the data of the currently used data set. You can interact with the created charts and tables, integrate them into an analysis, or use them to filter your analysis.
Note that Companion uses the full analysis model of the data set to retrieve the answer if you use a Viewers license or you have View privileges on the project or analysis. Only Manage access to projects defined in the data set limits the result.
Prerequisite
You use the Viewers license or you have the View privilege for the project or analysis.
Click the
 Companion button in the program header. The Companion chat panel opens with the General intelligence tab.
Click Your data to open the corresponding tab. The tab is available only in analyses.
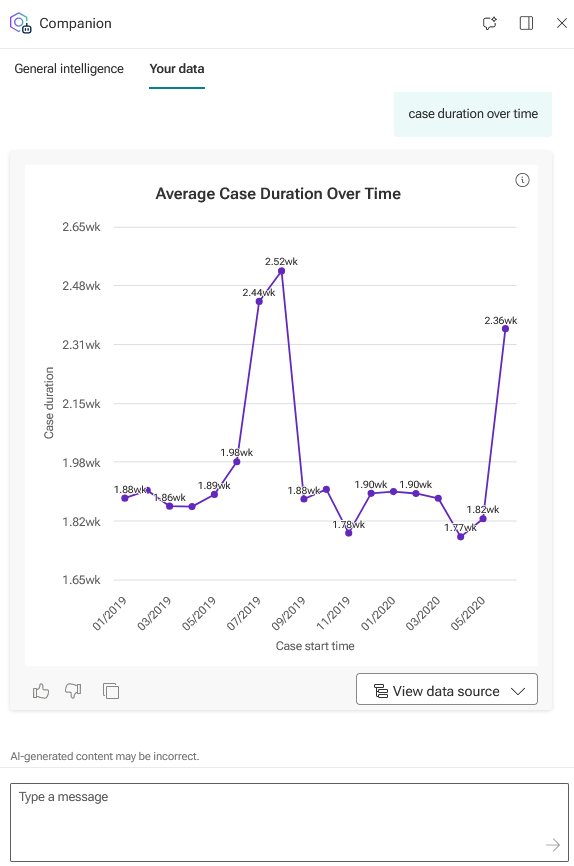
You can select a predefined question or enter your question or task in the chat box. For example, type "case duration over time" in the chat box and click the
 Send icon to send your message.
Companion displays a chart or table component in the Companion chat panel. See the example below.
You can copy the component to the clipboard and paste it into an app of your analysis. The copy option is available only if you have at least the ARIS Process Mining Analyst user role.
Click the
 Copy component icon in the chat panel.
Use the currently opened app or open another app of your analysis.
Click the
 More options icon in the analysis header > Paste the component copied.
The copied component is inserted into the opened app.
To view the criteria used in the component, click the
 Info icon in the component.
To view a detailed description of the criteria used in the component, click View data source below the component.
You can add a like or dislike for the results created by Companion by clicking the
 Like or
  Dislike icons. Your votes are used to enhance the analysis results.
You can use fields created by Companion for calculating the result of your questions or tasks.
To start a new conversation, click the
 icon. When you start a new conversation, the current chat history is deleted.
Note that the chat history is only stored on the client side. Chat history is lost when you close the current browser tab.
You asked Companion to help you analyze your process data.
You can use Companion in many ways to refine and personalize an AI-based component. For example, you can enter "show as bar chart" or "show as table" in the chat box to change the chart type of the component or display the data in a table instead of a chart.
You can also use the component to filter the data of your analysis or to select symptoms to analyze root causes.
To configure the view of the Companion chat panel, click the  Sidebar settings icon. You can collapse (
 ), expand (
 ), or pin (
 ) the panel. If you enable the Dock into view option, the panel becomes part of the view and elements such as the configuration panel, which could be covered by the Companion chat panel, are displayed next to the chat panel.
The example shows the chart created by Companion for the task "case duration over time".