Display the earliest and latest values of a date measure
You can display the values of the earliest and latest date of a date measure, such as the Case start time.
Add a component to the App builder, for example, a line chart.
Add a measures of the Date type to the selected component. You can add one or more measures to the component.
Click + Add measure on the Configuration panel of the component. The Model panel opens.
On the Model panel, select a measure of the Date type, for example, Case end time. The Select aggregation panel opens.
Specify the aggregation to obtain the earliest or latest date of the measure value. Select Minimum (Min) as the aggregation for the earliest date values or Maximum (Max) for the latest date value.
Click Done.
The value of the earliest or latest date of a selected date measure is displayed in the component.
If you added an additional dimension to the component, the latest or earliest date values are displayed for each dimension value.
Note that the Minimum and Maximum aggregations are also available for date measures when creating a scripted definition.
You can configure date measures in the same manner as any other measure. For example, if you added two measures, you can assign one measure to the primary Y-axis and the other one to the secondary Y-axis. On the Configuration panel, move the mouse pointer over a measure, click  Configure, and select an axis from the Y-axis and labels drop-down menu. To configure the individual axes, select Customize from the drop-down menu on the Configuration panel and specify your settings.
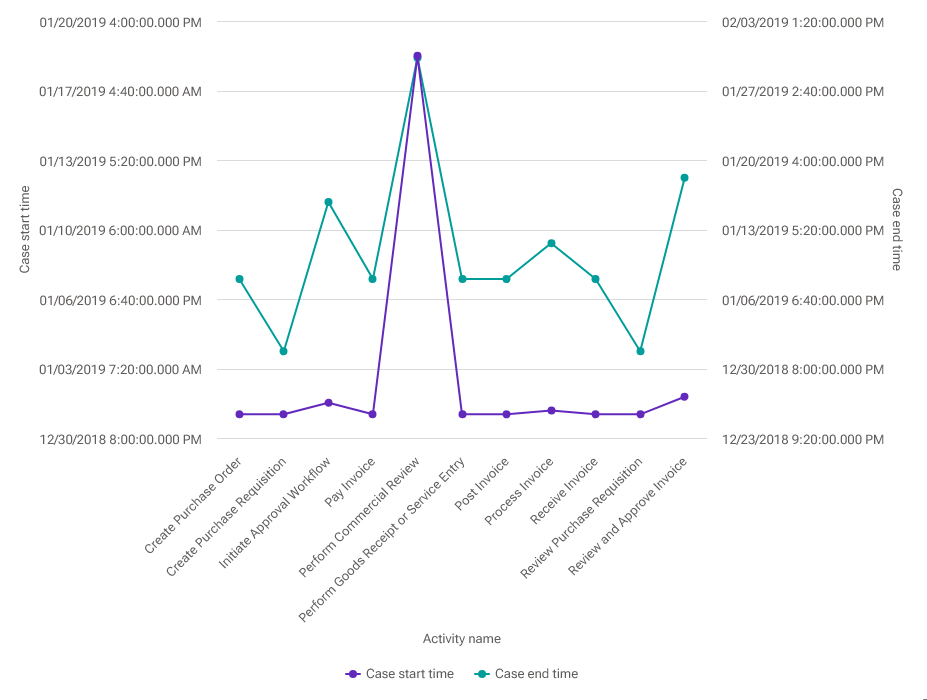
The line chart displays the values of the earliest date of the Case start time and Case end time measures for the Activity name dimension. The individual measures are assigned to different axes in the line chart.