Overview
The Overview tab provides a unified view of conformance and rule check results. This view lets you quickly determine the compliance of your cases. The tab shows the most important compliance criteria of your analysis.
Number of conformant and non-conformant cases
Number of compliant and non-compliant cases
Compliance rate
In the Detailed compliance view in the lower section of the Overview tab, you can display both the conformance and compliance check results together, or only the conformance or compliance check results at a time.
Set selections
You can set filters by selecting data points in the individual charts. All other charts on the tab are filtered according to your selection. As with all other analysis apps, you can use filters in the Conformance app. For example, you can save and combine filters. For details, see the chapter Filter processes.
Conformant versus non-conformant and compliant versus non-compliant cases
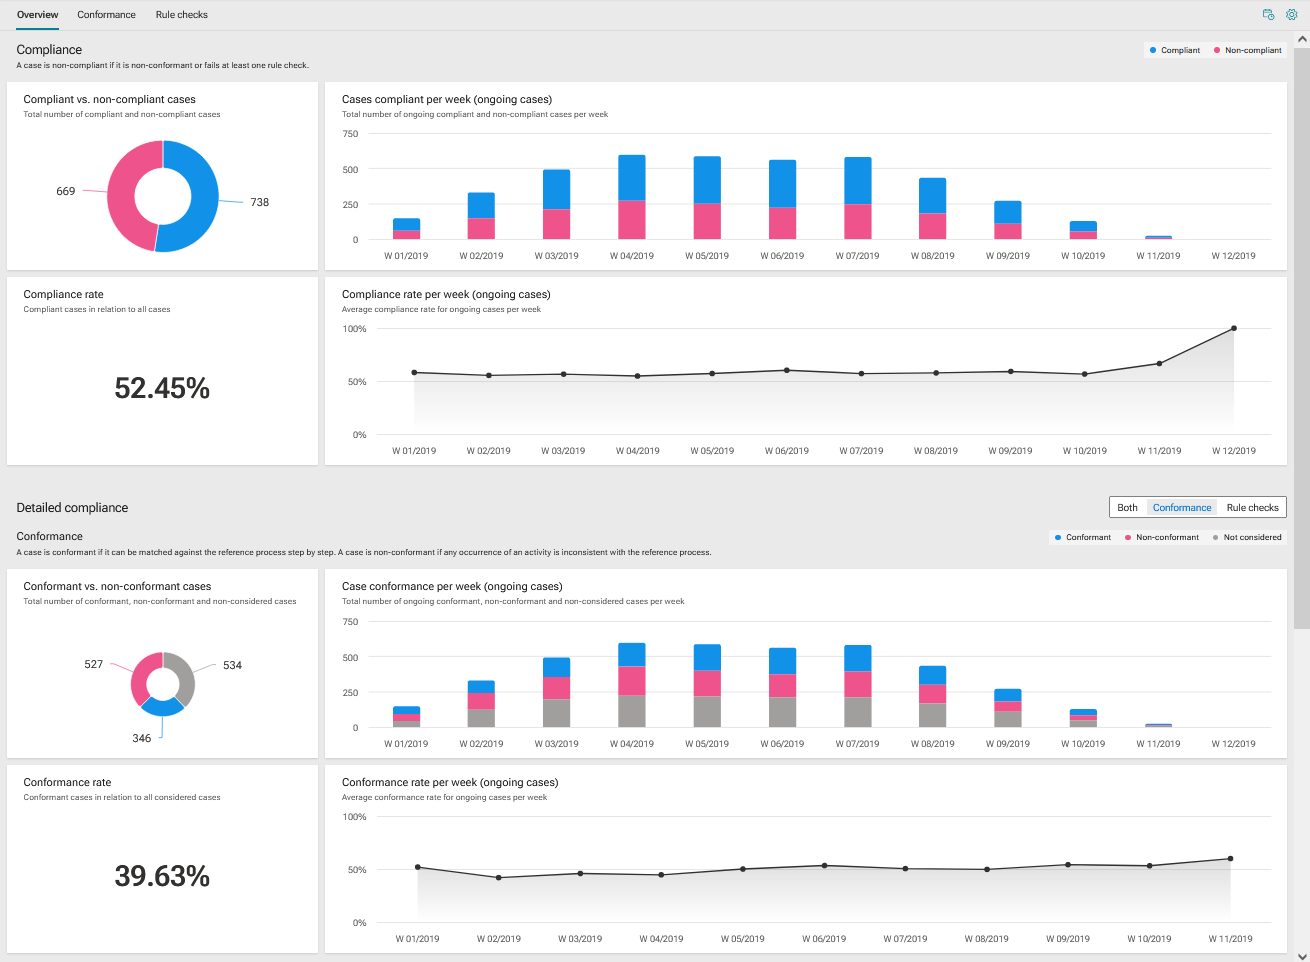
The pie charts show the total number of conformant/compliant (marked blue by default) and non-conformant/non-compliant (marked red by default) cases. The corresponding column chart shows the distribution of the cases within a period.
If your ARIS Process Mining version supports the multiple selection of reference processes, the charts with the result of the conformance check additionally display non-considered cases. Non-considered cases are cases that are not included in the conformance check due to the filters defined for the reference processes. Non-considered cases are marked gray in the charts.
You can select the individual parts of the pie chart to filter the corresponding cases.
You can also filter the period in the column chart. Select a column to filter the cases at a specific point in time. When you select a column, a slider is displayed. Move the slider with the mouse pointer to set a period on the timeline.
Conformance rate and fitness value
The Conformance rate and the Fitness chart (not displayed in the example below) display their values corresponding to your selection, for example, the conformant cases at a selected time. If you have not filtered any cases, the values apply to all cases. The corresponding line charts show the distribution of the conformance rate or fitness value within a period.
As with the column chart, you can select a point in time, or you can set a period using the slider. The slider is displayed as soon as you select a point in the line chart.
The example shows the Detailed compliance view for the Conformance. The conformance check also includes the non-considered cases (marked gray in the charts).