Configure the format of time span values
You can configure the format for measure values of time span type, such as activity cycle time or activity duration. You can specify the format of time span values displayed on axes, data points in charts, or in tables.
The following time span formats are available:
No formatting - Time span values are displayed in their base format in milliseconds (ms).
Example
156,274,389.43875954ms
Field output format - Time span values are displayed with selectable granularity, such as hours or day, and the number of decimals.
Example
47.21hr or 1.97d
Automatically abbreviated (default) - Time span values are automatically abbreviated. The number of decimals is selectable.
Example
47.21hr
Percentage - Time span values are displayed in percentage. The number of decimals is selectable.
Example
15,627,438.94%
In the Configuration panel of the component, move the mouse pointer over the measure and click
 Configure. The Configuration panel of the selected measure opens.
Select the format for the time span value in the Format drop-down menu.
Example
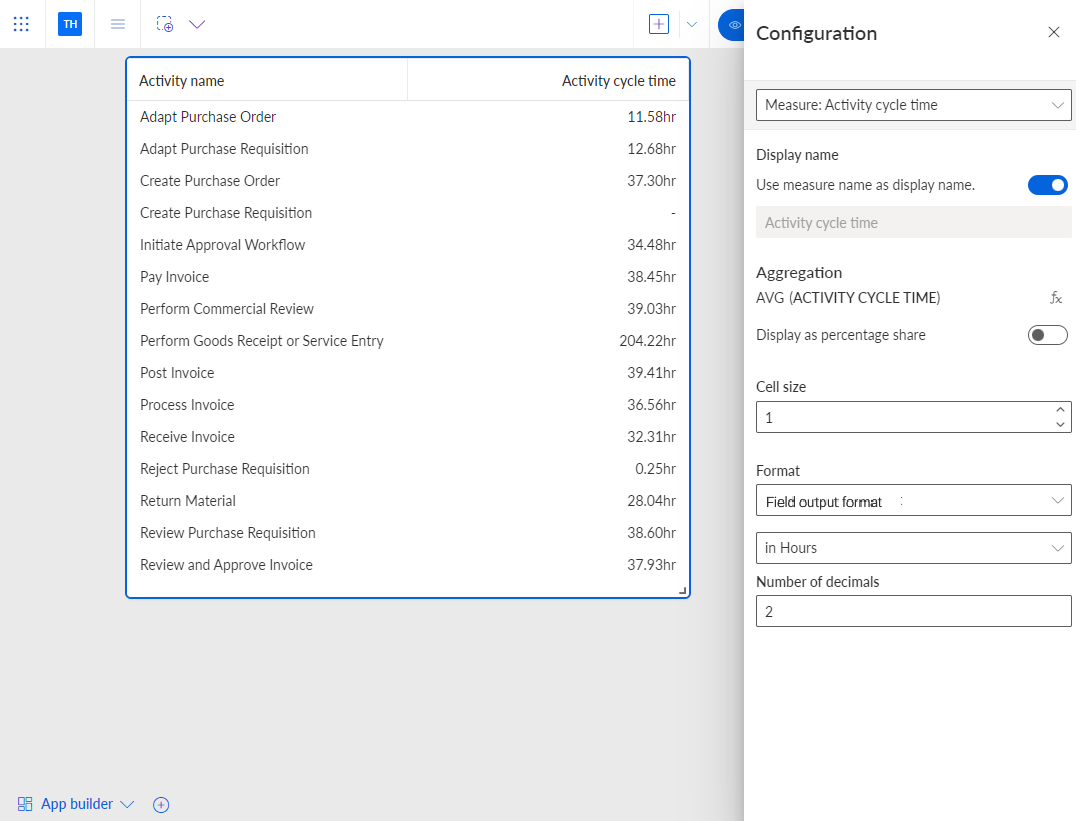
The table displays the Activity cycle time measure of the Time span data type. The values are formatted using the Field output format displayed in hours.
You can display and format the measure values at the data points in a chart, such as a line chart. Data points are not available in tables.
Change the chart type, for example, to a line chart if required.
Enable the Data point labels option in the Configuration panel of the corresponding measure.
Select the format for the time span value in the Format drop-down menu. Different options are available depending on the selected format.
Example
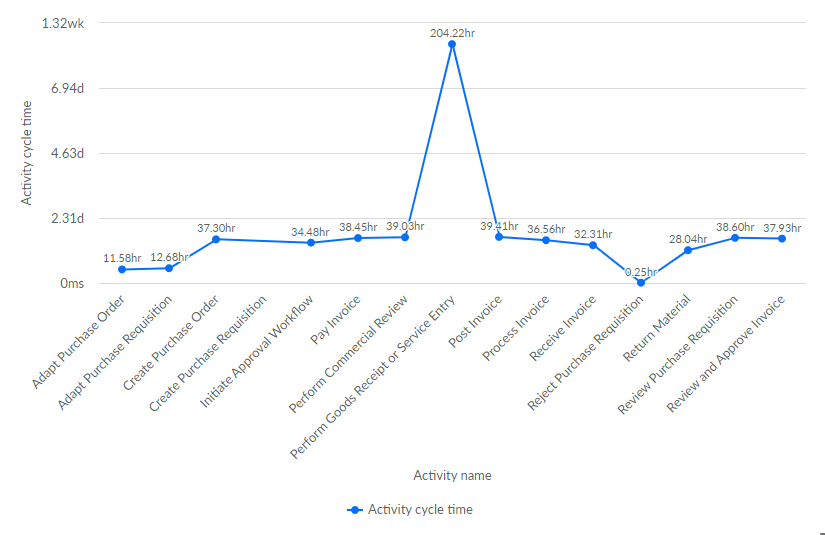
The values of the Activity cycle time measure are displayed on the data points in the Field output format in hours.
You can display and format the measures on the primary and secondary Y-axis in a chart.
In the Configuration panel of the component, move the mouse pointer over the measure and click
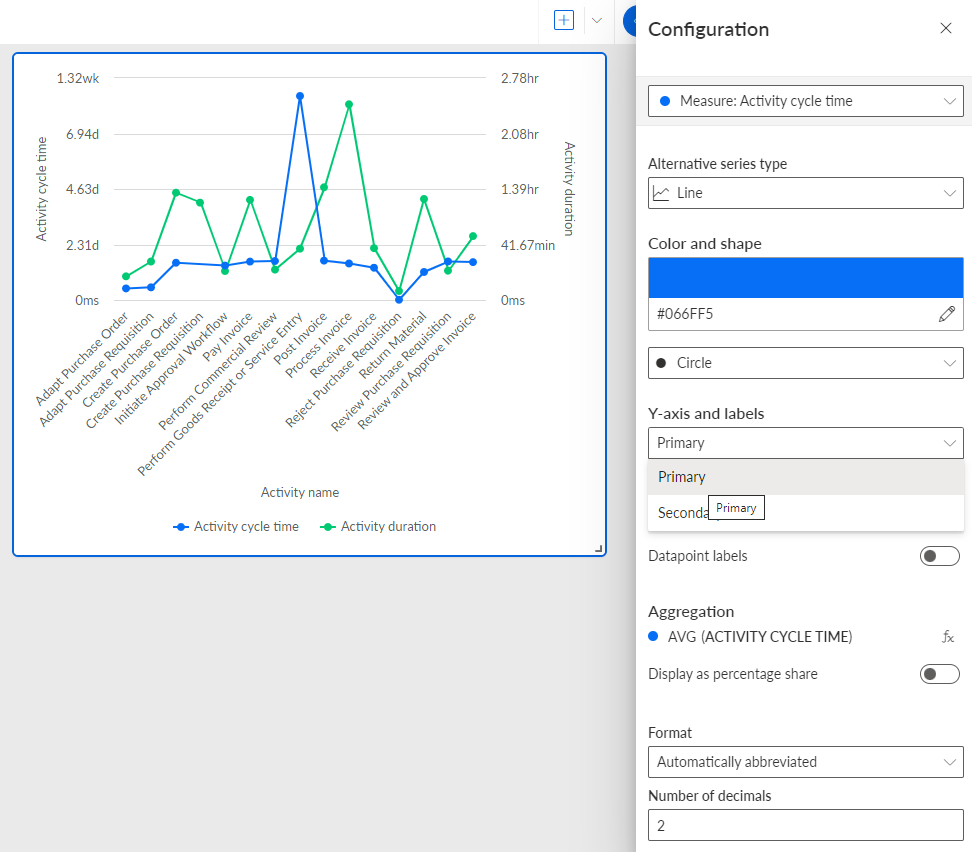
Configure. The Configuration panel of the selected measure opens.In the Y-axis and labels drop-down menu, select the axis on which you want to display the measure values. The primary axis is the left axis and the secondary is the right Y-axis.
Example
A line chart with two timestamp measures assigned. The Activity cycle time on the primary axis and the Activity duration on the secondary axis.
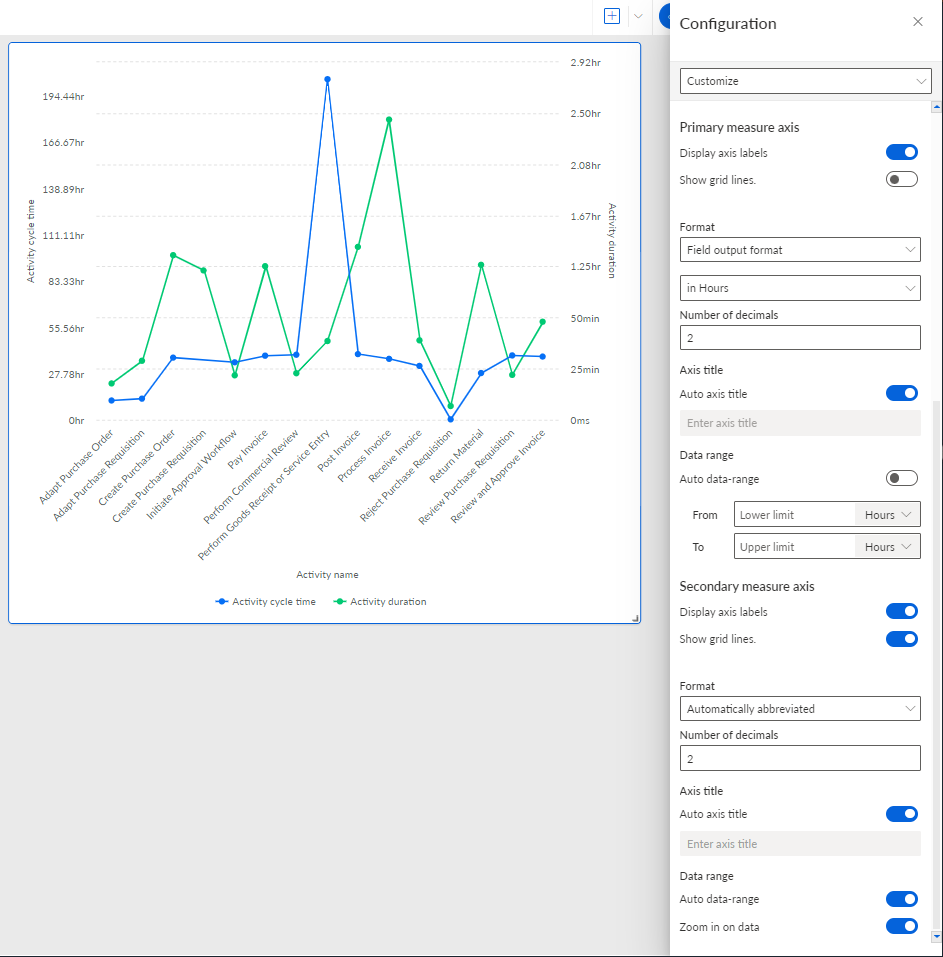
Select Customize in the drop-down menu at the top of the Configuration panel. In the Customizing options, you can configure the display and format of the measure values for each Y-axis separately.
Disable the Display axis labels option if you do not want to display any measure values.
Select the format for the time span value in the Format drop-down menu.
If you want to specify the data range of the measure values manually, disable the Auto data-range option and specify a lower limit and an upper limit for the values to be displayed.
You have configured the format for a measure with time span values.