Specify a partition for the criteria in your analysis
You can partition the criteria displayed in your analysis based on an addition criterion. That means, you can add a dimension or measure to your analysis to divide the values according to another criterion.
If you add a partition to your analysis, you can add more than one dimension but only one measure to your analysis. If you select a measure as a partition criterion, you cannot apply an aggregation to the measure values.
You want to analyze the average activity cycle time for each activity and view the result based on the executing organizational units. The analysis criteria are Activity cycle time and Activity name. The partitioning criterion is Executed by.
Create or open an analysis using the App builder.
Add a analysis component, for example, a line chart.
Select the component on the dashboard and then click the
 Configure icon. The Configuration panel opens.
Click + Add dimension, select a dimension, for example, Activity name, and click Done.
Click + Add measure, select a measure, for example, Activity cycle time, then select the aggregation type, for example, Average (AVG), and click Done.
The average activity cycle time for each activity is displayed in a line chart.
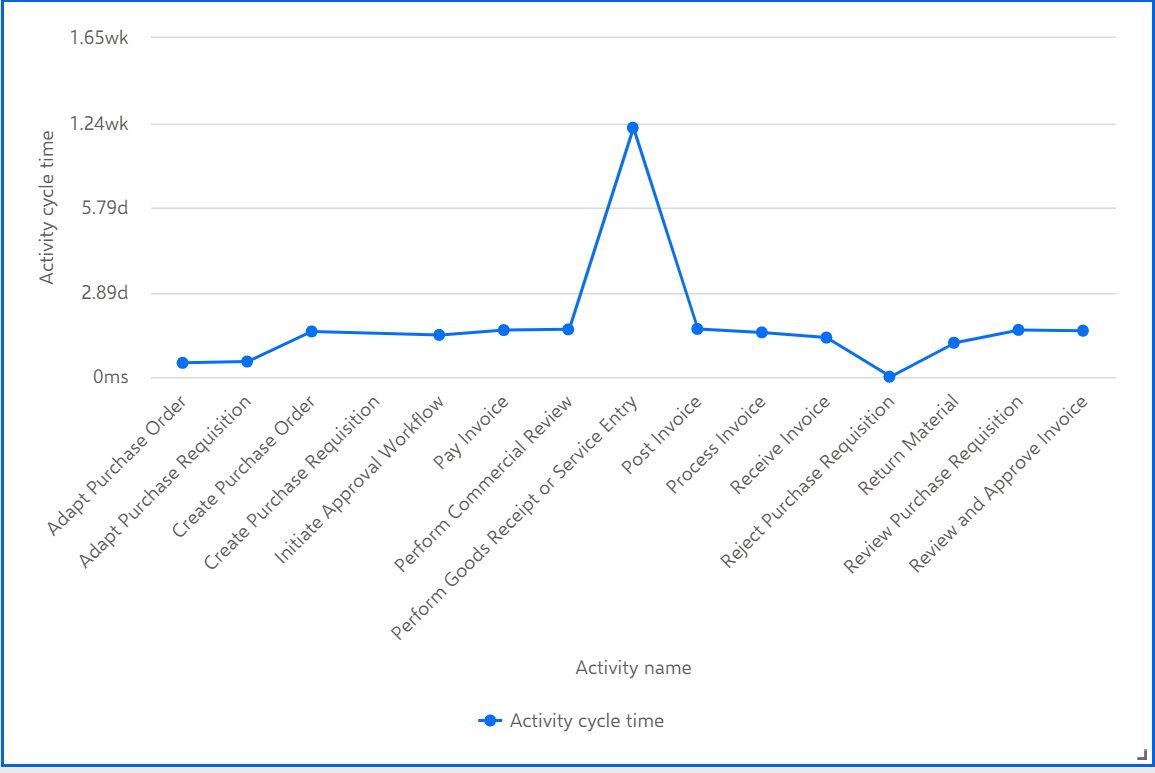
To partition the values based on a certain criteria, click + Add partition, select a criteria, for example, Executed by, and click Done.
The line chart shows the average activity cycle time for each activity depending on the executing unit. The legend of the partitioning criteria is displayed below the chart.
You can move the mouse pointer over a data point in the chart to display more information.
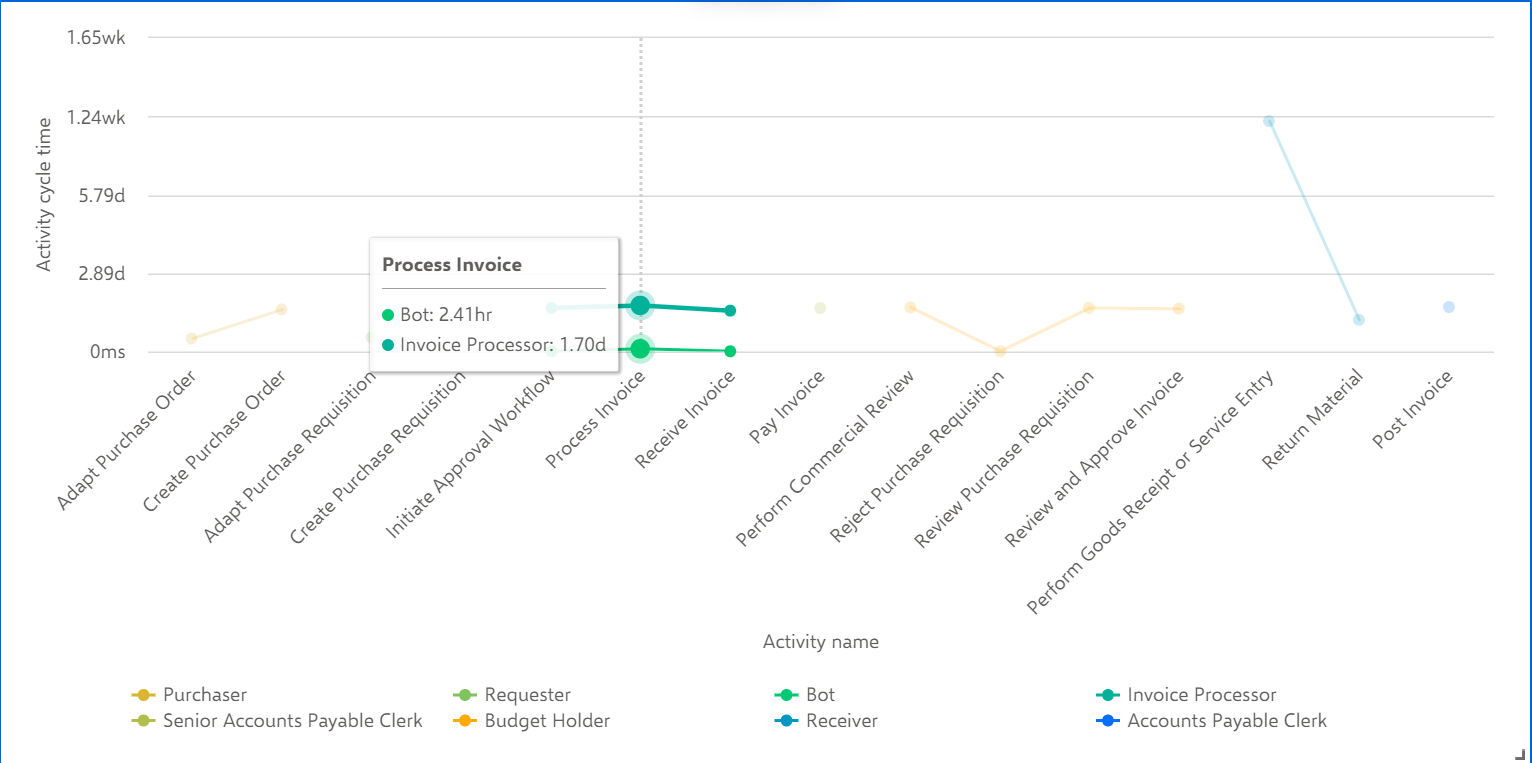
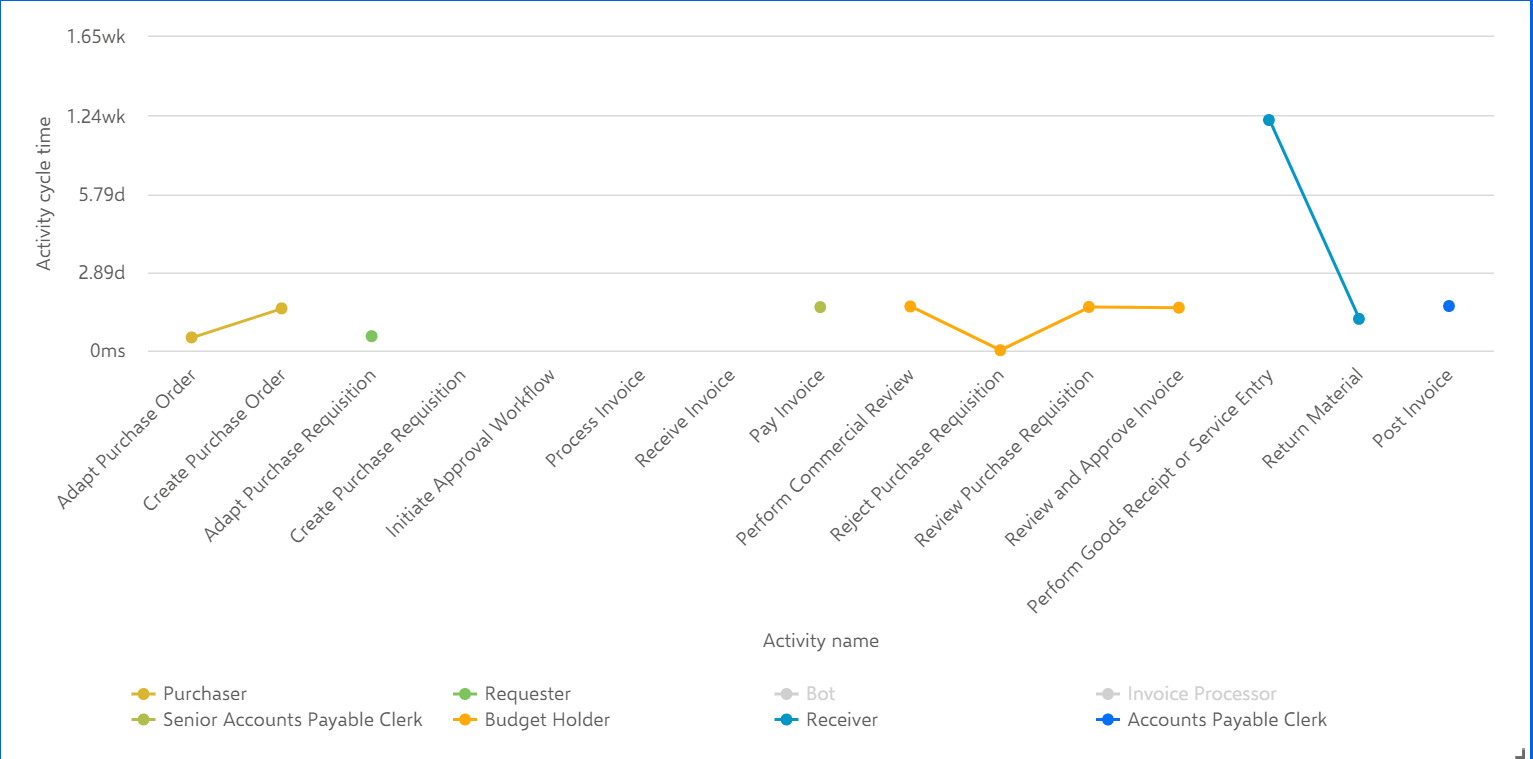
You can filter the values in the analysis using the values listed in the legend. Move the mouse pointer over a value in the legend to highlight the corresponding values in the chart. If you select one or more values in the legend, the corresponding values are hidden in the chart. In the example below, the Bot and Invoice Processor are selected.
Tip
You can configure the layout of the partition criterion. Move the mouse pointer over the partition criterion and click the  Configure icon. You can specify the color, shape and display name of the individual partition values.