Use the Model panel
Use the Model panel to select the fields to use as dimensions and measures for your analysis, and to specify the aggregation type for calculating the measure values. You can select dimensions and measures of  Number,
  Text, or
  Date type.
On the Configuration panel, click + Add dimension or + Add measure to select one or more dimensions or measure. The Model panel opens with the fields that you can use as criteria for your analysis.
You can expand or collapse the entire field list in the Model panel by clicking the
 Expand or
  Collapse icon. Click the > icon to expand only the list of specific object types, such as the Activity or Case objects.
To show the hierarchy of objects textually, click the
 icon -> Hierarchy view. The names of the objects are extended with the hierarchy, for example, Case/Activity or Case/Connection. The object hierarchy represents the data structure of the analysis model, for example, activities and connections are subordinated to the cases.
To show the hierarchy of objects graphically, move the mouse pointer over an object, such as Activity or Connection, and click the
 icon. A corresponding graphic is displayed.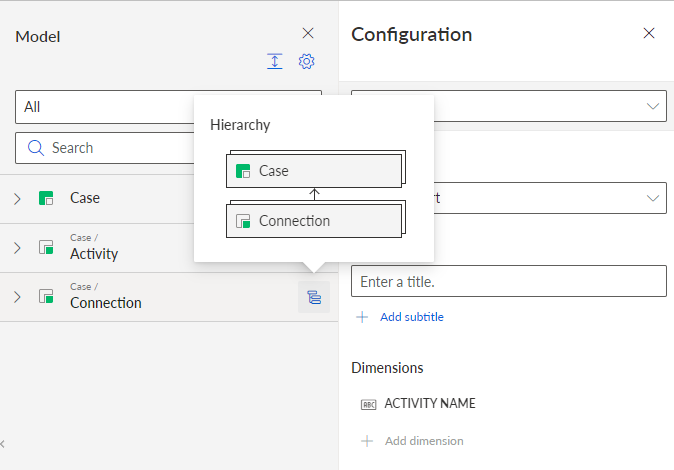
You can filter the fields displayed in the Model panel. By default, all supported fields for the selected criterion and component are displayed. For most components, you can select dimensions and measures of
Number, Text, or Date type. Some components allow only one data type, for example the Time series chart. In this case, only fields of the corresponding data type are provided.Click the drop-down menu and set the filter. By default, All (data types) is preset in the drop-down menu. You can select the data type of the fields to be displayed in the list:
Number, Text, or Date. You can also filter the fields by their object, that is, by Case, Activity and Connection objects.Example
The filtered field list in the Model panel shows only the fields of the Activity object of
Text type.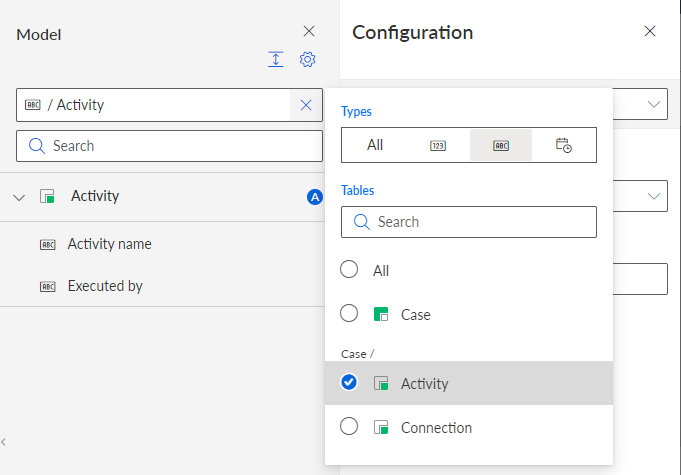
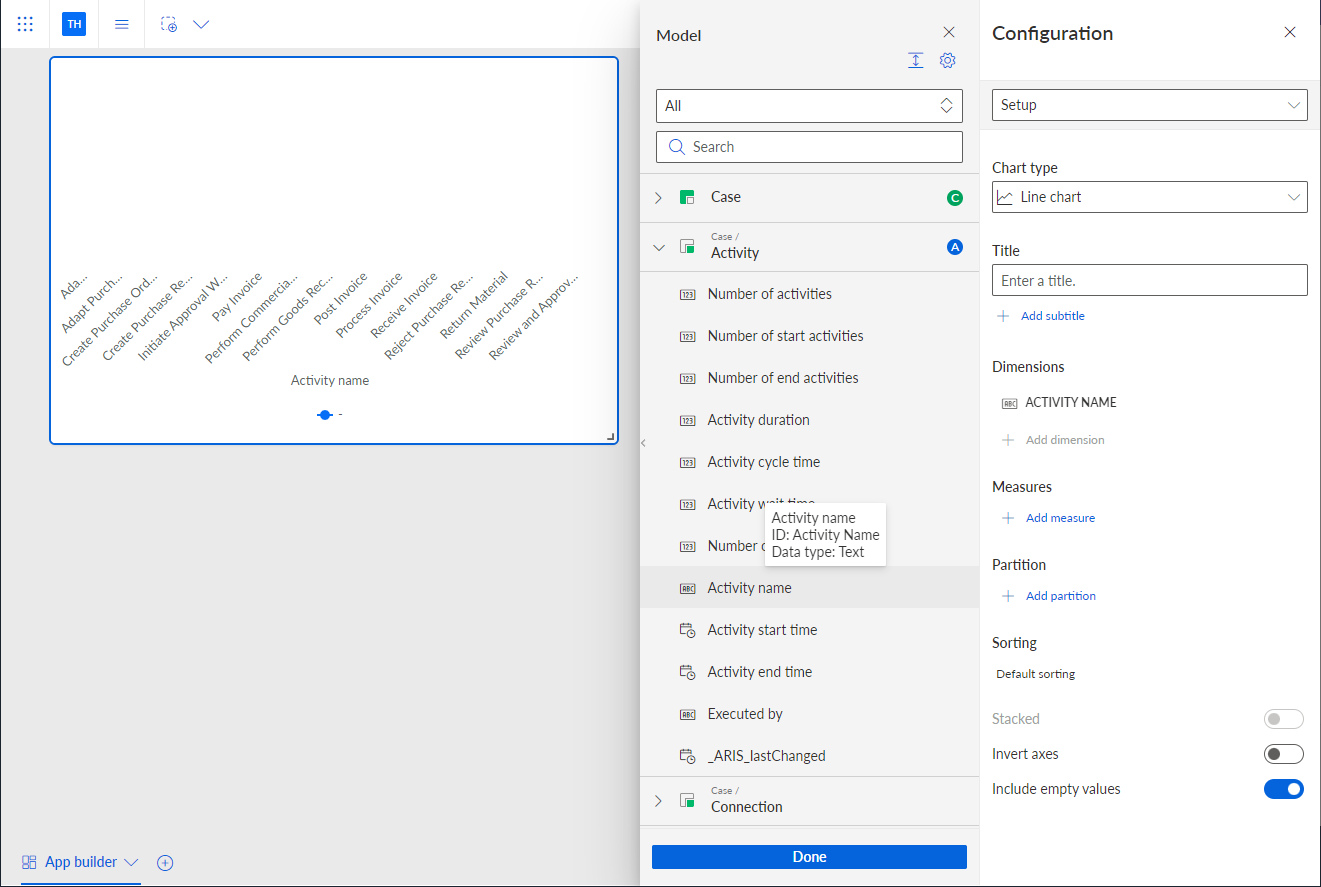
Select a field to use as a dimension or measure.
Example
The Activity name criterion is added to the line chart as dimension.
When you select a measure, specify the aggregation type to calculate the measure values, such as Average or Count. Note that if you select Median or Count distinct values as aggregation, the result of the calculation is approximate and not exact.
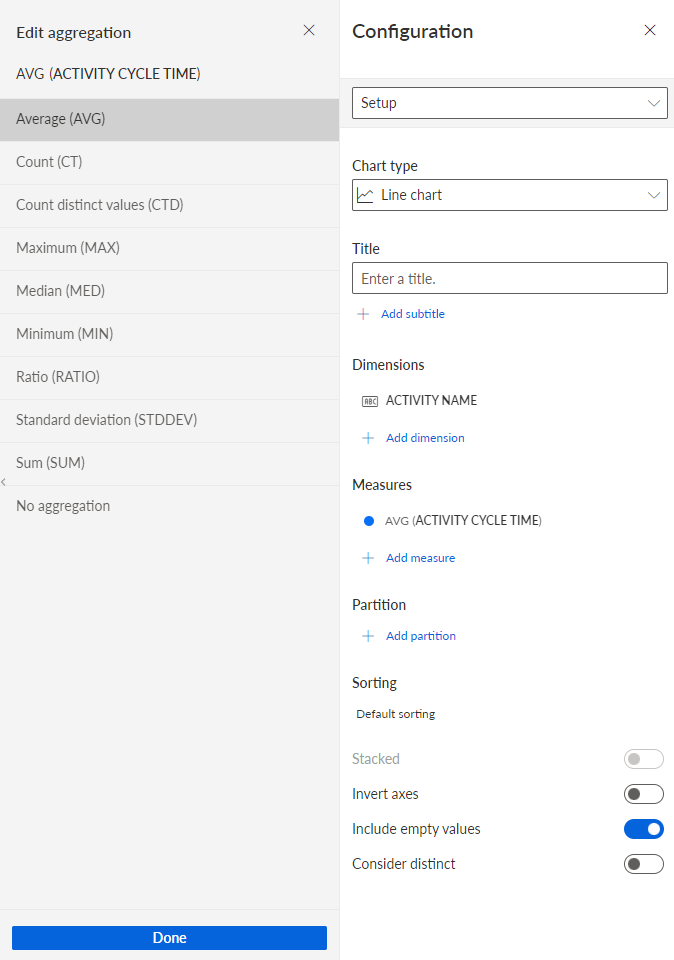
Click Done.
The selected criteria are added to the Configuration panel and displayed in the component. You have assigned dimensions and measures to the app component for your analysis.
You can create and add calculated fields to the Model panel, which you can use as analysis criteria.