Use the App builder
You can create your own app using the App builder. Creating your own app allows you to configure your analysis individually. You can choose between various chart types. You can also specify different dimensions and measures to visualize your process data.
If the analysis does not contain an app, select App builder. The App builder opens.
If the analysis already contains an app, the analysis opens in view mode.
Click
 Open Edit mode in the analysis header. The analysis opens in edit mode.
Click
 Add new app at the bottom of the analysis and select App builder. The App builder opens.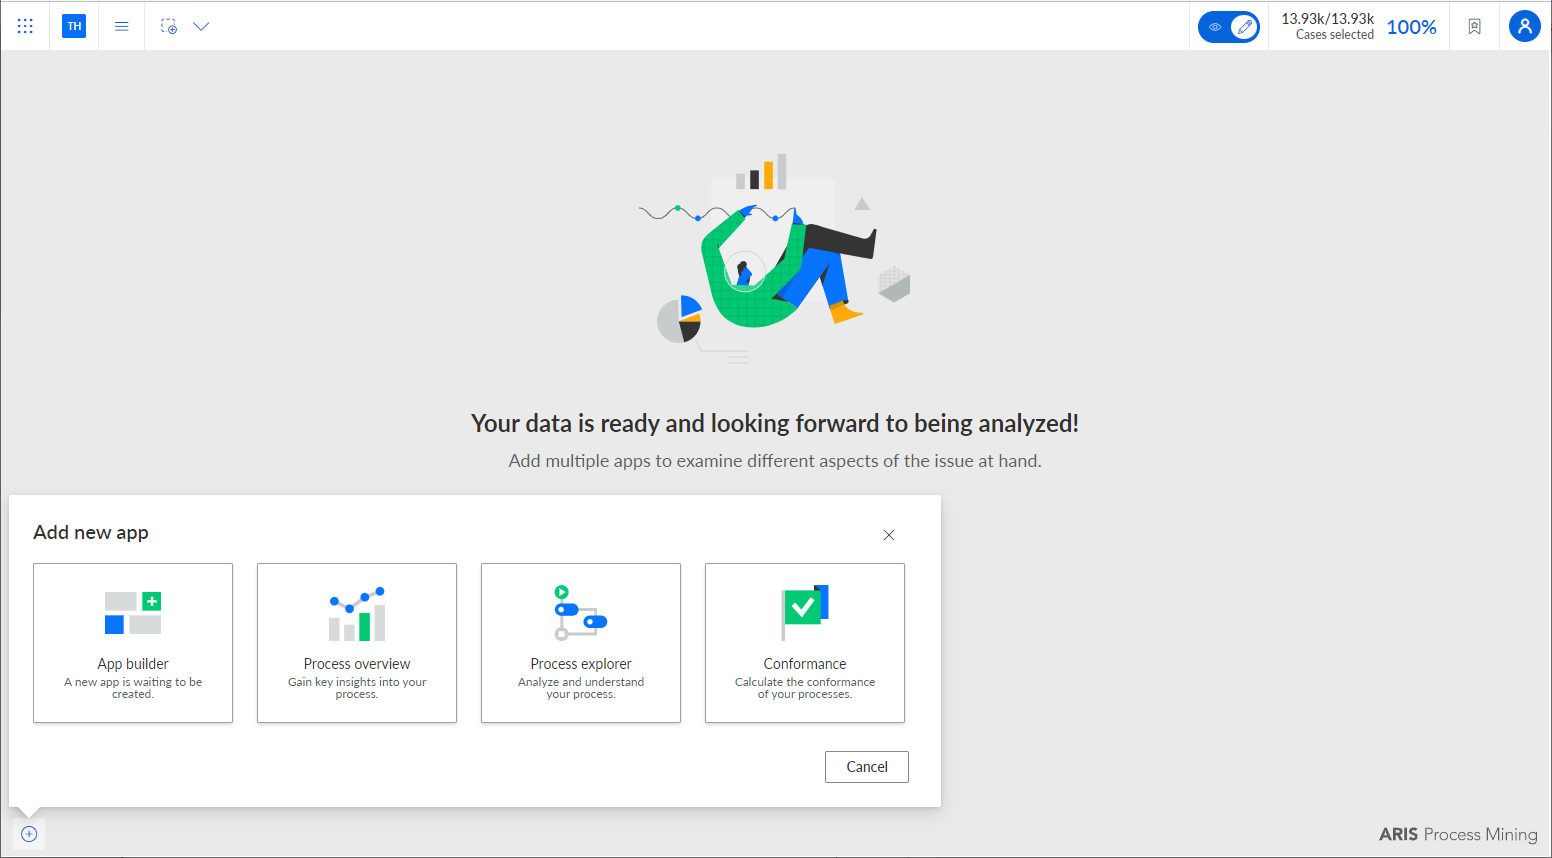
Add one or more components to your app to visualize your data, such as a line chart or a table. Click
 Add a new component. The Configuration panel opens.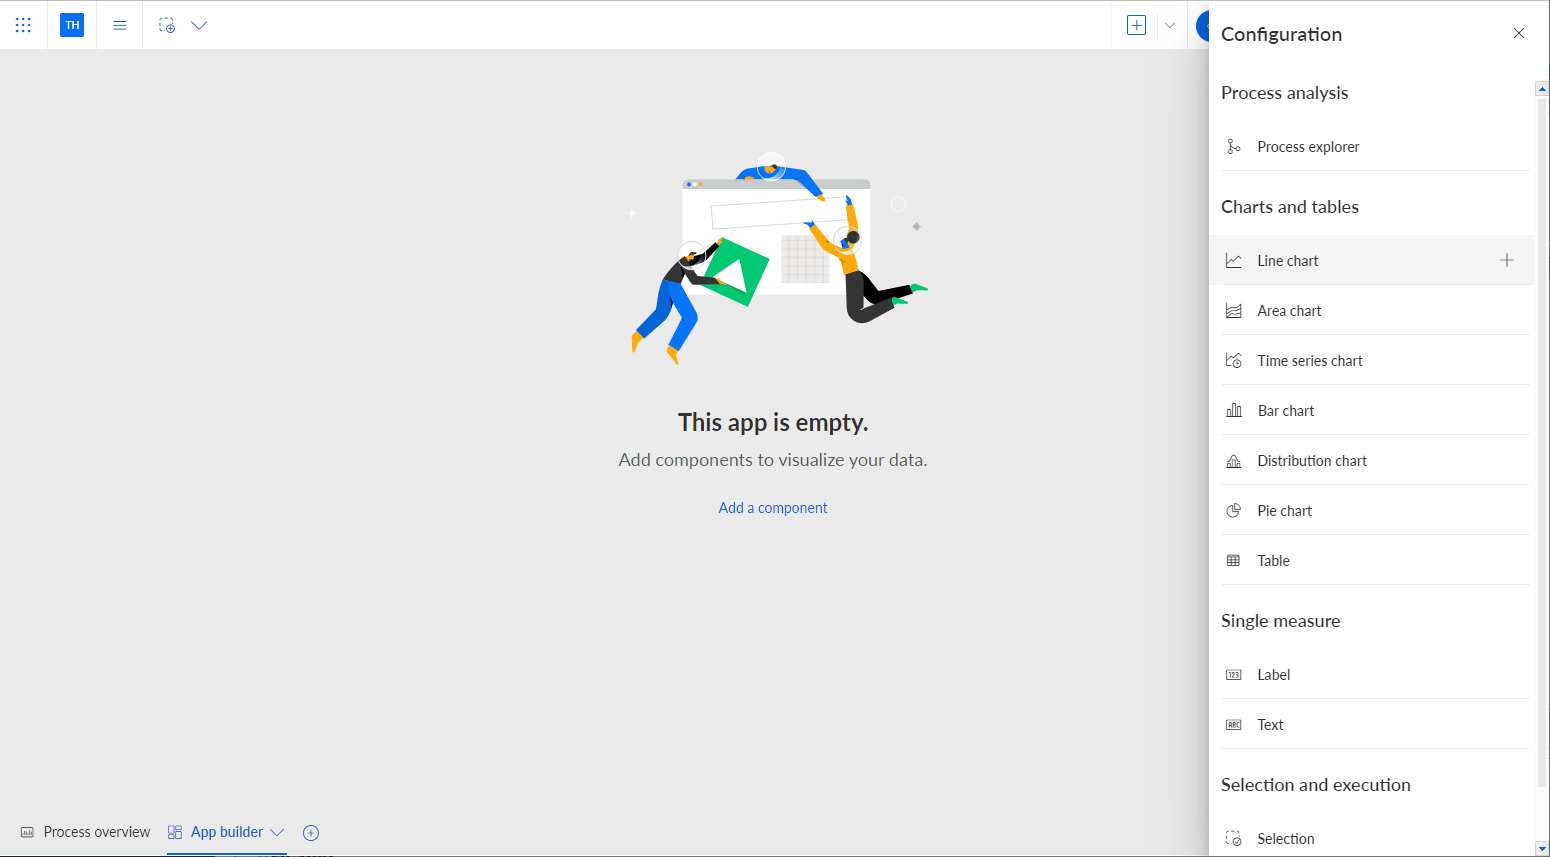
Select a component in the Configuration panel.
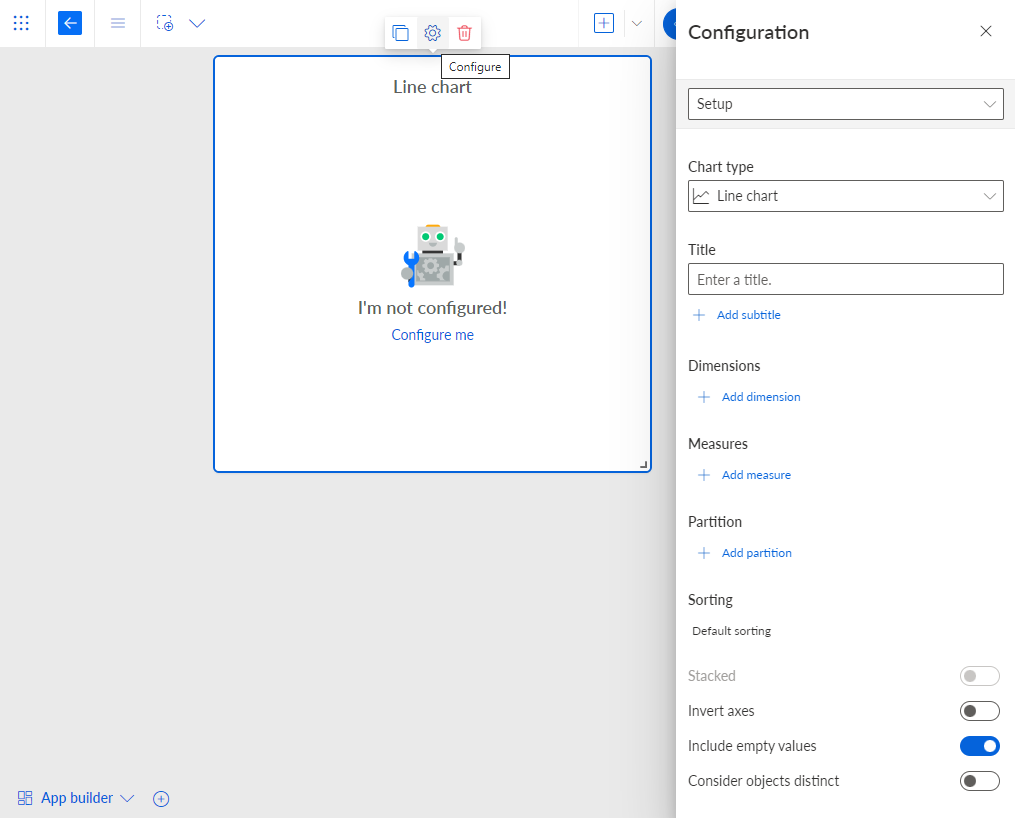
The selected component is placed in the app. The Configuration panel automatically opens with the corresponding Setup options. To open the Configuration panel of a component manually, select a component in the app and click the
 Configure icon.
Use the Setup options to assign the data to the component and to set up the component. The Setup options provided depend on the selected component.
Example
The Setup options of the selected Line chart component are displayed in the corresponding Configuration panel.
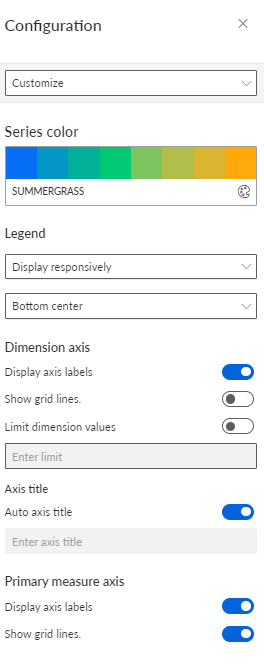
You can customize the component layout. For example, you can change the colors, display a legend, or specify the dimension and measure axis settings.
Click the drop-down menu in the first line of the configuration panel.
Select Customize.
Specify your settings.
Example
Details of the Customize options
You can duplicate or copy a component inserted into an app. The duplicated component is automatically inserted in the current app and the copied component can be inserted into another app, for example. When copying or duplicating, all settings including selections are taken into account.
You have created your own app. Your settings are saved automatically.
You can open your new app in view mode. In view mode, you can use an analysis interactively. It offers some functions that are not available in edit mode. Click the  Open View mode icon in the analysis header to switch to view mode.