Explore the process reality
With the Process explorer, you can analyze the sequence of activities within your business processes. You can use the Process explorer to clearly display and evaluate the process structure and the relationship between the activities.
Move the mouse pointer over an analysis in the Project panel.
Click
 Add new app. A selection of available apps is provided.
Select Process explorer. The Process explorer is opened on a separate tab.
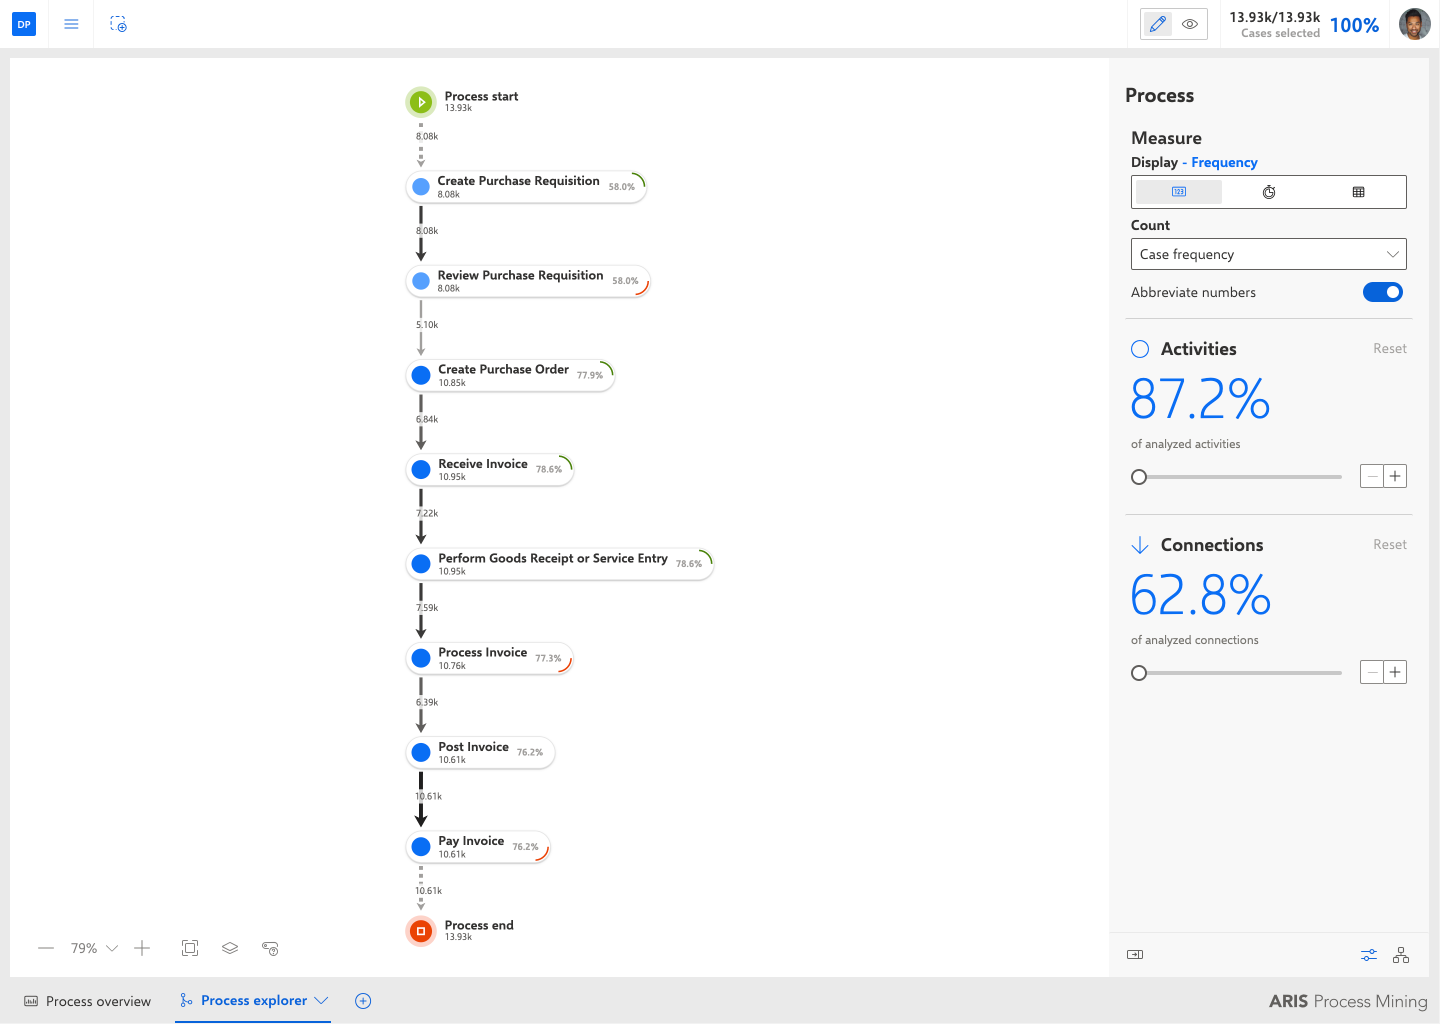
Initially, the Process Explorer shows the most common process, that is, it shows the activity flow that occurs most frequently.
Click an activity or a connection to display detailed information. The details are displayed in a corresponding panel.
When you select an activity, you can display additional information about the incoming and outgoing connections. To do this, click Connections in the panel.
Select the measures to be analyzed in the Process panel. Initially, the
 Case frequency measure is selected.
To display the Activity frequency measure, click the Number drop-down menu, and select Activity frequency.
To analyze the Throughput measure, click the
 Throughput icon, and select an aggregation type in the corresponding drop-down menu.
To analyze another measure, click the
 Measure icon, and select a measure in the corresponding drop-down menu. You can also select an aggregation type in the Aggregation drop-down menu.
You can display the values for the activities, for the connections, or for both elements. Click Configure and enable the desired option.
You can include or exclude activities or connections in the analysis. To do this, use the corresponding sliders, or the -/+ icons to increase or decrease the corresponding percentage.
You now have a first impression of the process flows.
The Process explorer app displays the process that is build by 87.2% of all available activities and 62.8% of all available connections.