Get a first grasp
The Process overview app provides basic information and historical progress about your process data. It quickly gives a first impression of the process data and points out interesting aspects for further analysis. The app shows different aspects of your process data using different chart types. For example, it shows the development of the throughput time over a certain time period in a trend diagram.
Move the mouse pointer over an analysis in the Project panel.
Click
 Add new app. A selection of available apps is provided.
Example
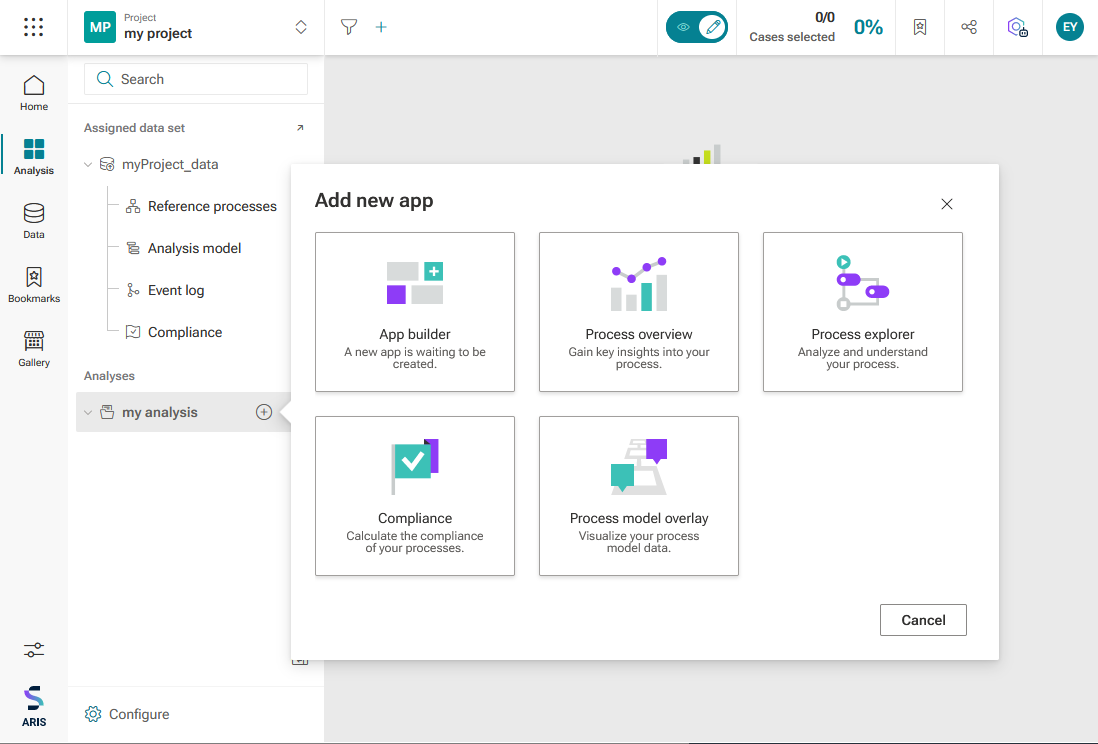
Click Process overview.
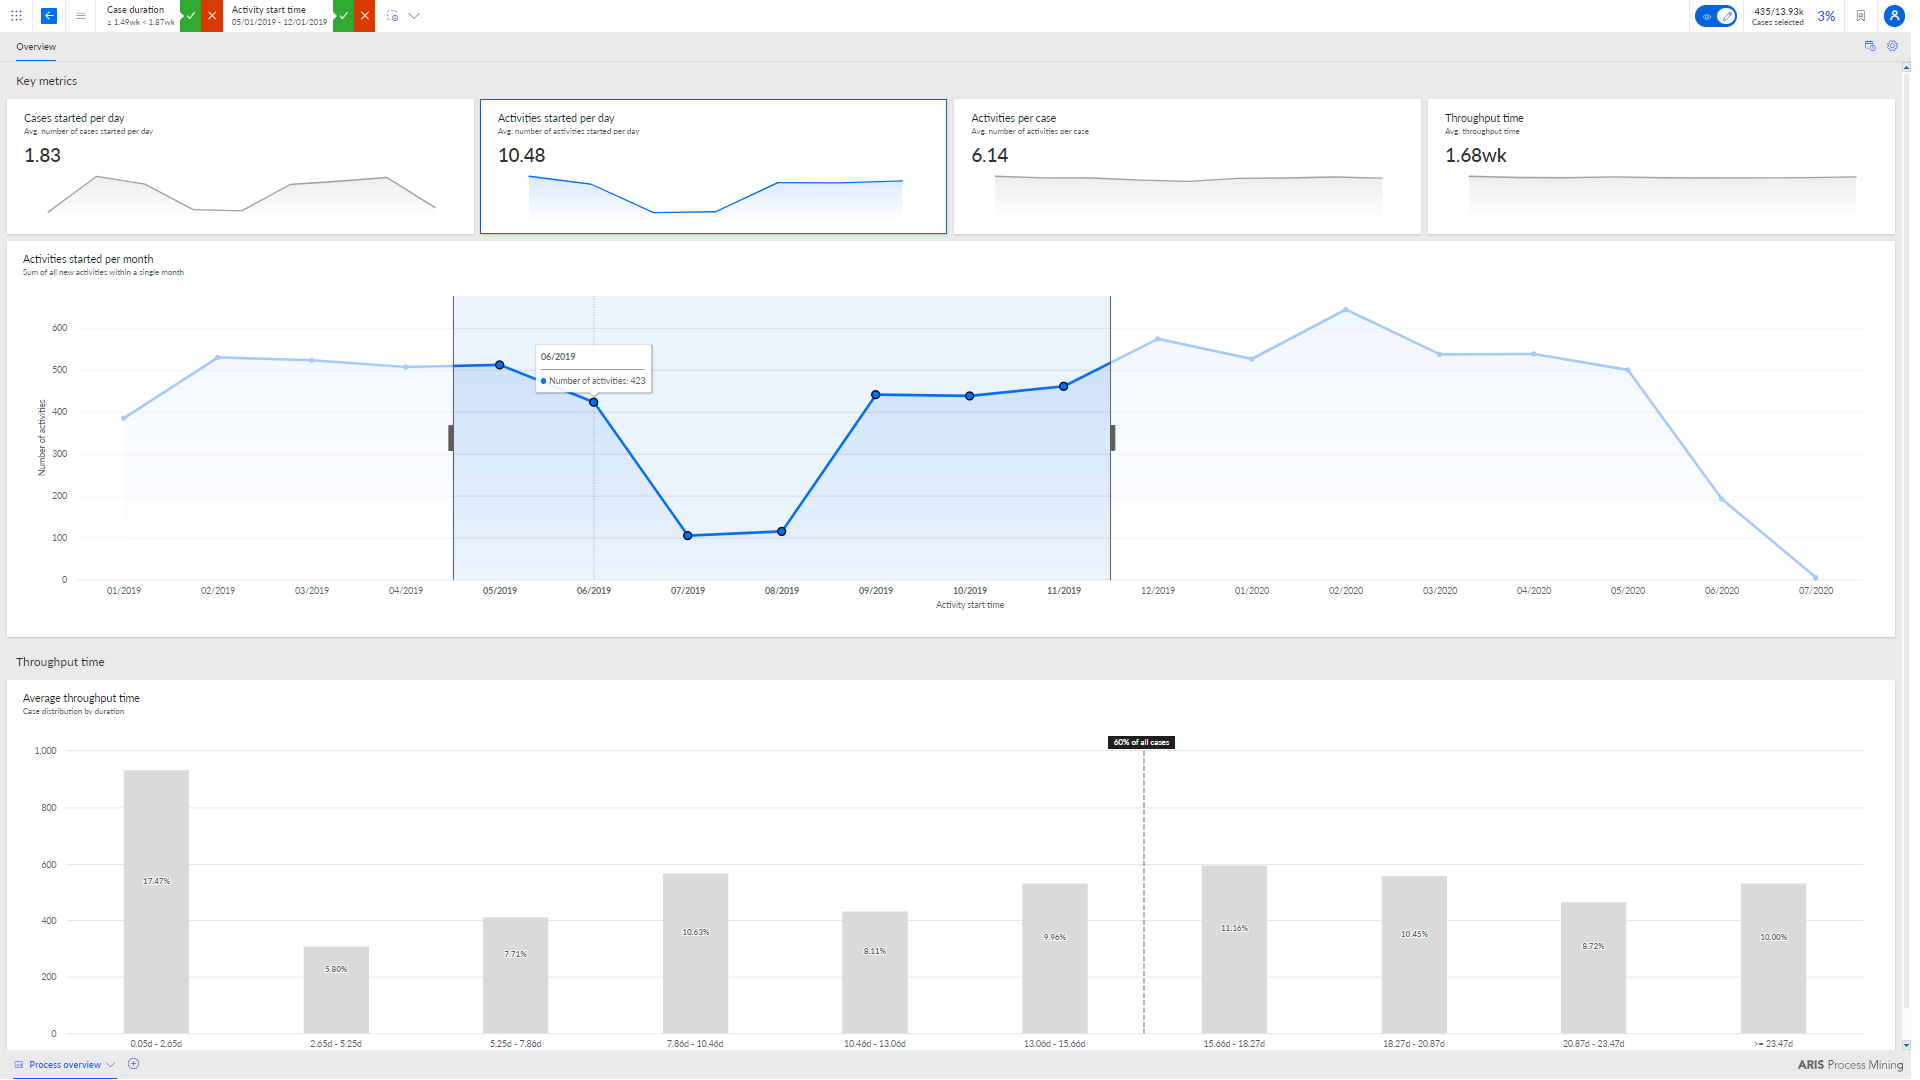
The analysis opens with the Process overview app. See the example below.
Select the key metrics that you want to analyze, such as the cases or activities started per day.
The trend chart shows the corresponding analysis of the selected key metric.
You can change the time frame to filter the data to be analyzed.
Click the
 Time frame icon and select a predefined time frame, such as last year or last month.
In the trend chart, you can change the time frame by moving the two sliders with the mouse pointer.
You can also move an adjusted time frame completely. To do this, click the time frame, hold down the mouse button, and move the mouse pointer.
You can specify a time scale the data is displayed in, for example, per month or per week. To do this, click the
 Option icon and select a time period. For more details, see the chapter Use the Process overview app .
You now have a good overview of the development of your processes.
For more details about the Process overview app, see the chapter Use the Process overview app .
The Process overview app with the trend chart showing the number of activities started within the selected time frame.