Set time dimension and scaling
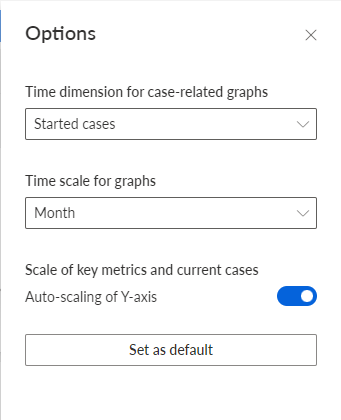
You can select the time dimension for case-related graphs, time scale for graphs, and enable automatic scaling for key metrics and current cases.
Click
 Options in the app header. The Options panel opens.
In the Time dimension for case-related graphs drop down-menu, you can select whether you want to analyze ongoing or started cases. Started cases are cases whose start time is in the time period under consideration. Ongoing cases are cases that have not yet been completed in the considered period.
For example, if the considered period is January, the started cases are all cases that were started in January. Ongoing cases are all cases that are not yet completed in January.
In the Time scale for graphs drop-down menu, You can set the scaling of the period displayed in the charts.
Enable the Auto-scale Y-axis option to enable automatic scaling of the values displayed on the Y-axis.
To set your settings as default, click Set as default. The option is available only if one of the options here has been changed.
Your settings are applied.
Example