Specify buckets for distribution charts
In a distribution chart, you can display the frequency distribution of a distributable measure's values for a number of cases. The values are divided into groups (known as buckets) on the x-axis, while the y-axis shows the number of cases (frequency) based on the values grouped in each bucket. You can configure the distribution of the values manually by defining a bucket interval, with each bucket containing the same number of values. Alternatively, you can have the distribution configured automatically.
Add a distribution chart to the analysis.
Select the distribution chart on the dashboard and then click the
 Configure icon. The Configuration panel opens.
Click + Add dimension and specify a dimension to analyze.
You can change the preset Number of cases measure and SUM aggregation type. To do this, you must first delete the preset measure and add a new one.
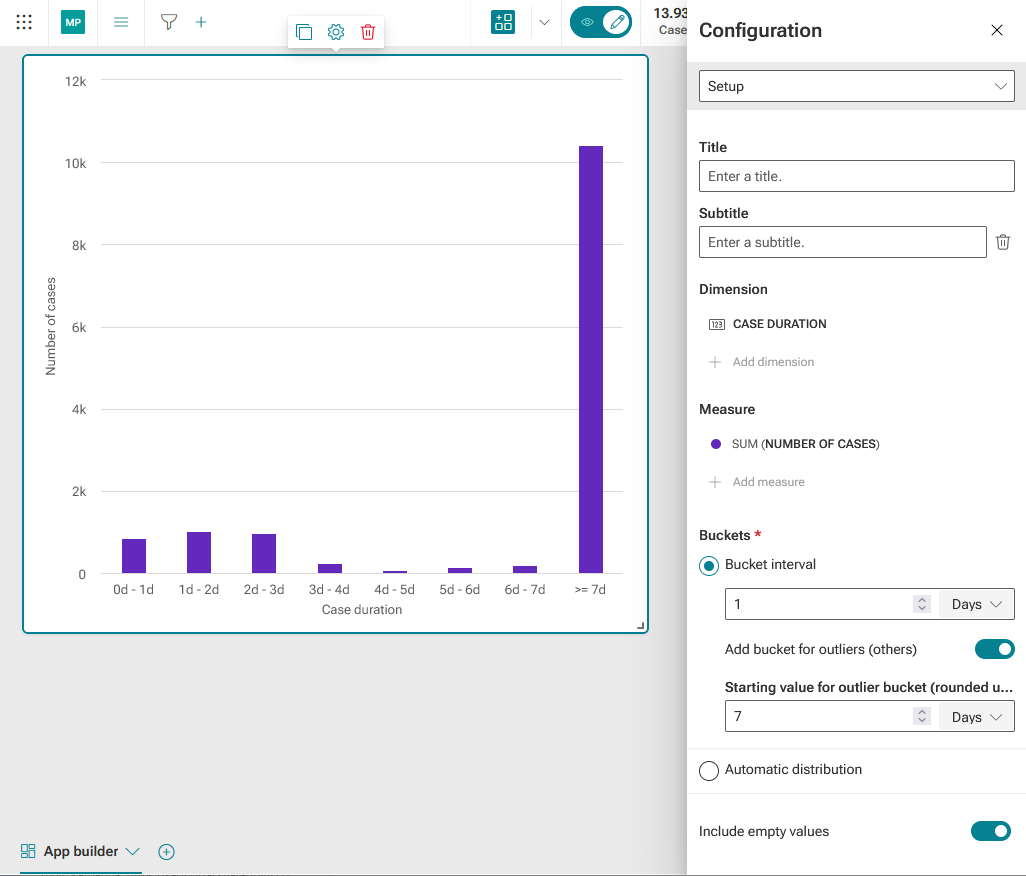
You can specify a bucket interval. This option is only available if you added a dimension. The interval size specifies the number of values per bucket. A bucket is an interval open to the right-hand side.
Enter a number in the Bucket interval input field.
Select the granularity or scaling from the drop-down menu, depending on the data type of the dimension.
Additionally, you can include outlier values into a bucket.
Enable the Add bucket for outliers (others) option and specify the start value for the outlier values in the corresponding input field. The value is rounded up to the nearest multiple of the interval.
You can have the distribution configured automatically.
Enable the Automatic distribution option.
Specify the number of buckets.
Additionally, you can include outlier values into a bucket.
Enable the Add bucket for outliers (others) option and specify the percentage of values to be included in the outlier bucket in the corresponding input field.
You specified buckets for a distribution chart.
The distribution chart shows the distribution of the number of cases for the Case duration dimension, grouped into eight buckets. The first bucket contains cases with a duration of 0 < 1 days, the second bucket contains cases with a duration of 1 < 2 days, ... The last bucket includes all outlier cases with a duration of 7 days or more.