Use the Quick check app
The Quick check app displays the result of a quick check that you performed in the Process explorer app. The Quick check app provides you with statements about how a process matches a quick-check selection and where both deviate from each other. In addition, you can refine the analyses by setting filters or by adding other measures, for example.
Note that the Quick check app is a temporary app. If you reload the page or close the app, the results are lost.
The app provides the Deviation analysis and the Case analysis tabs.
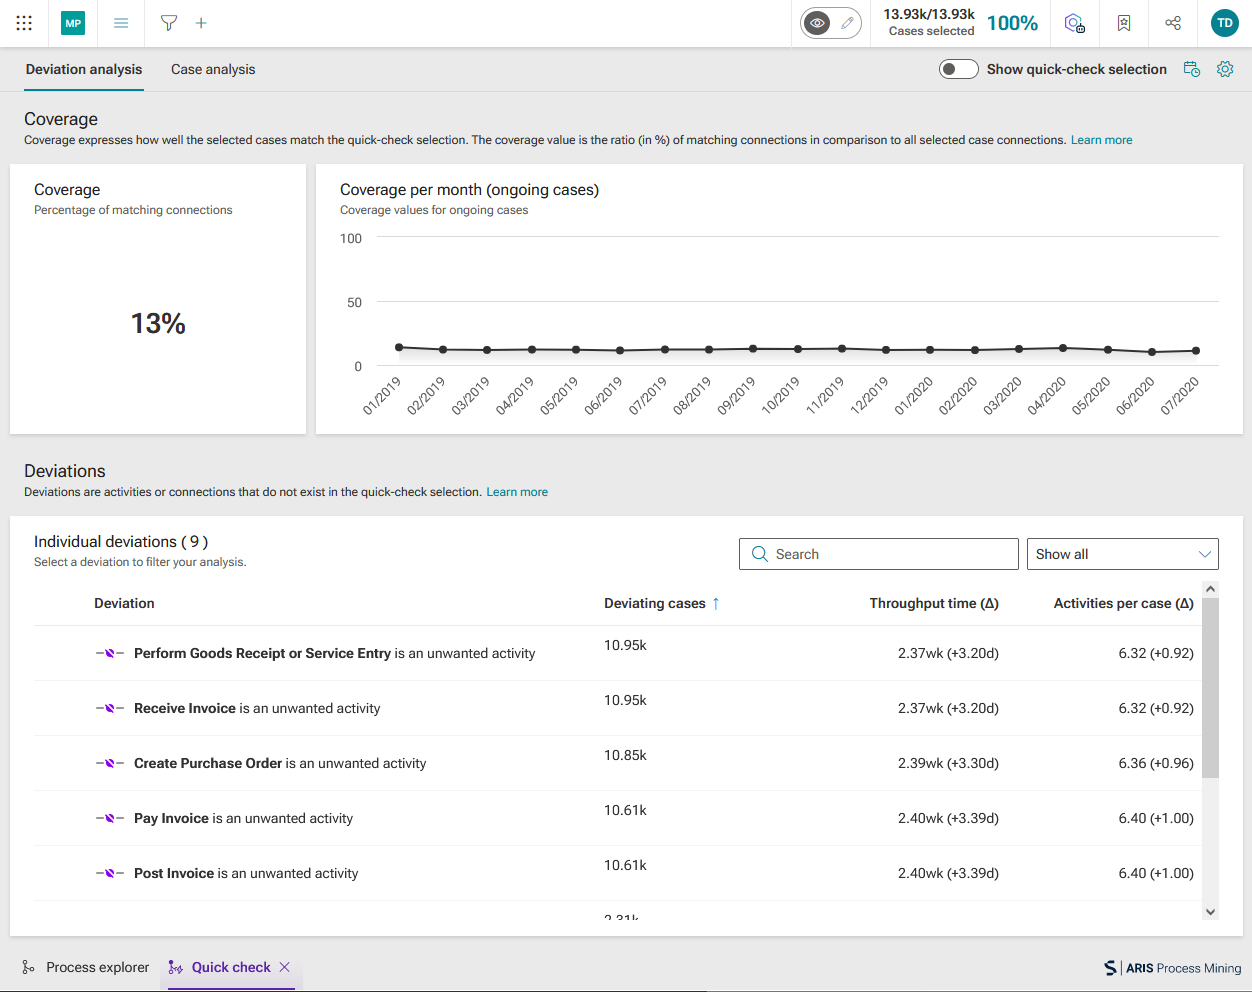
The Deviation analysis tab displays an aggregated view of the differences in the process structure. The Coverage value indicates how well the structure of the current cases matches the selection in the Process explorer that triggered the quick check. The coverage value is the percentage of the current connections that match the connections of the Process explorer selection.
The diagram also displays coverage over time. In addition, the tab lists specific deviations with more detailed information. You can specify a time range in the Coverage diagram or select individual deviations to specify filters.
Example
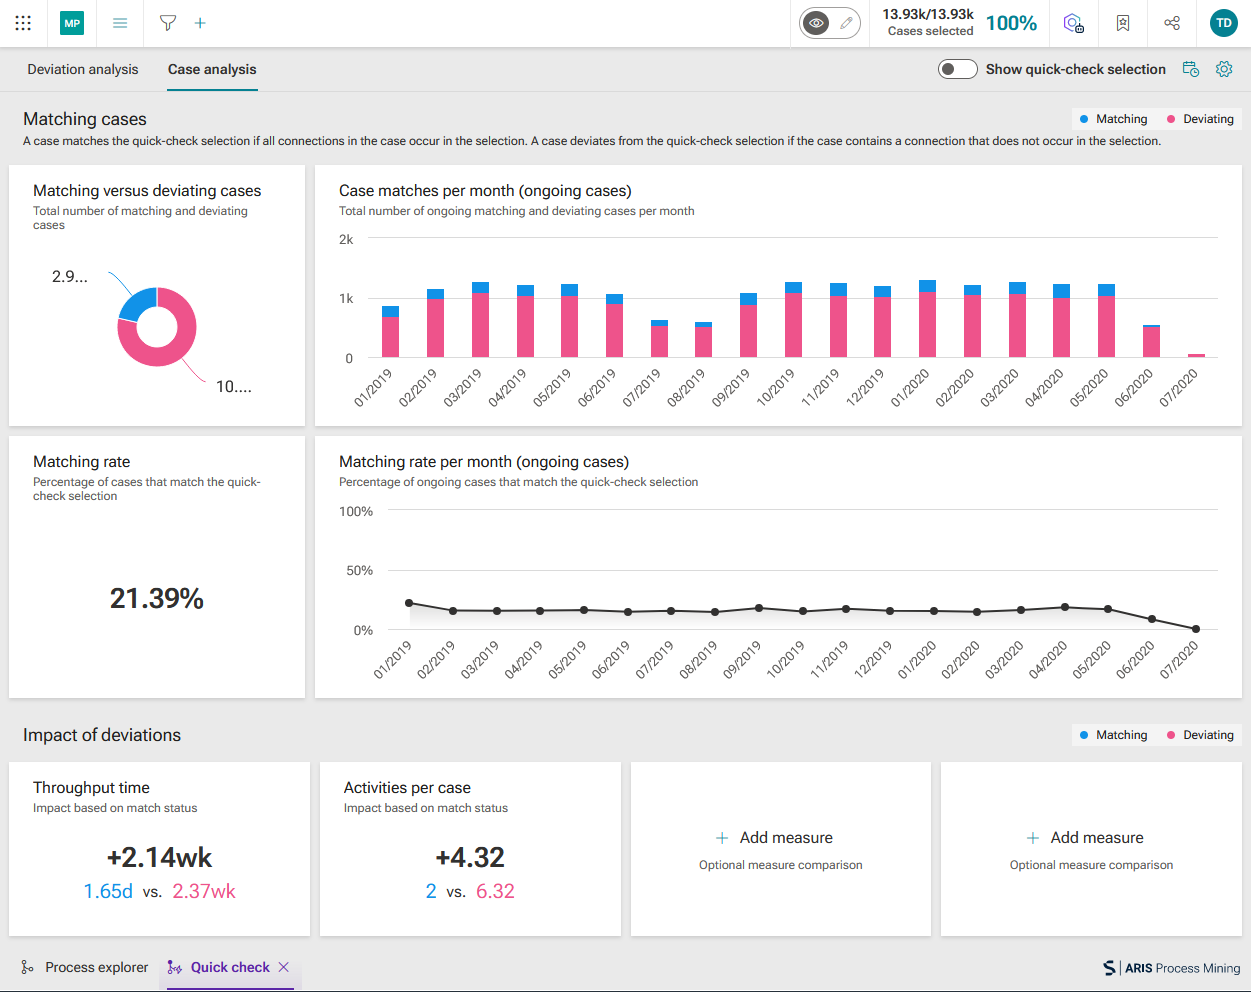
The Case analysis tab displays a detailed view of case analyses. For example, the tab displays the total number of matching and deviating cases or the percentage of cases matching the quick-check selection. You can specify a time range in the Case matches ... and Matching rate ... diagrams to specify a filter. The tab also shows the impact of the deviations on various measures. By default, only the values of the Throughput time and Number of activities measures are displayed. However, you can add other measures for analysis. The measures are calculated for matching and deviating cases.
Note that loading the values on the Case analysis tab may take longer due to the large amount of detailed information.
Example
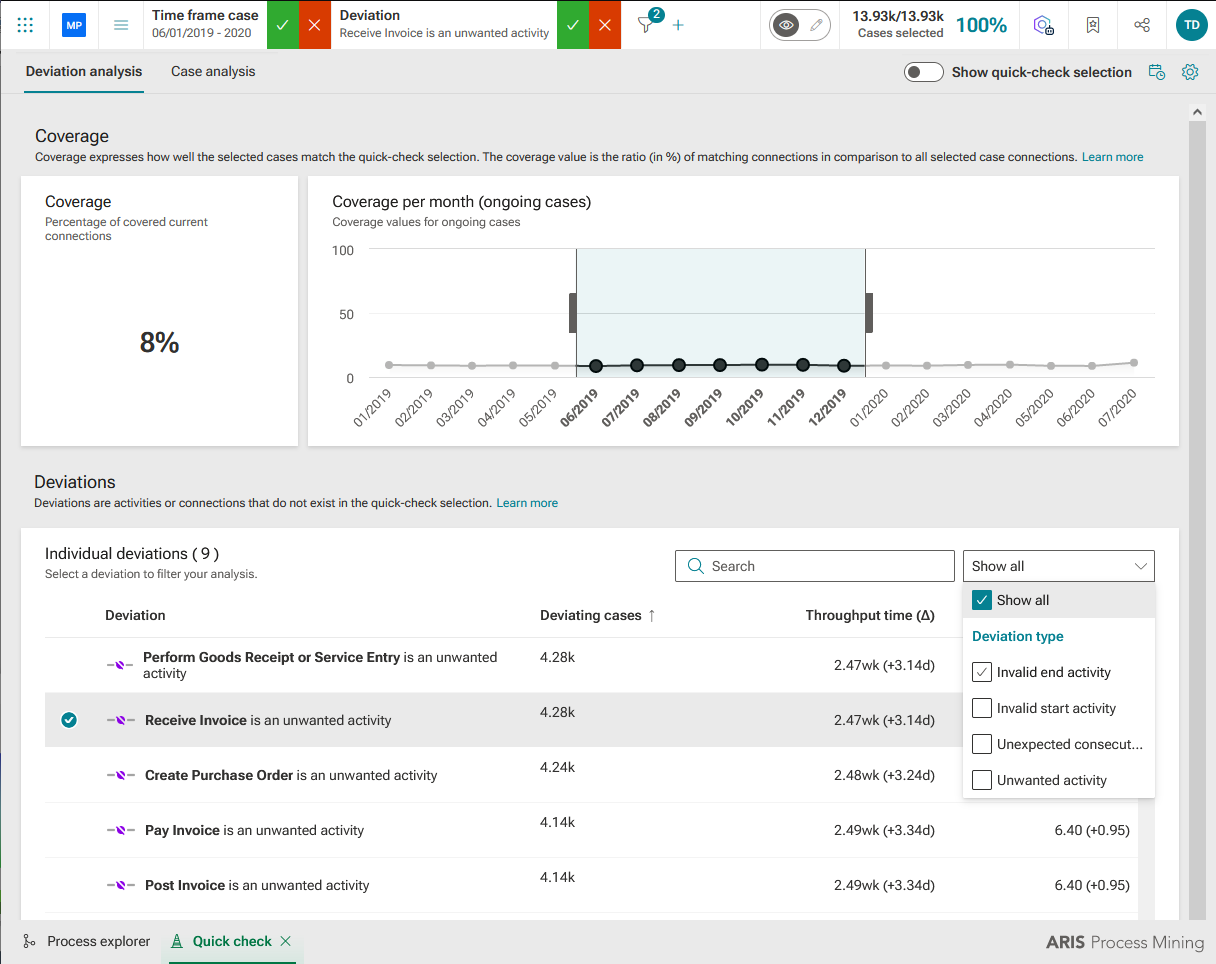
On the Deviation analysis tab, you can configure various filters.
You can specify a time range as a filter in the Coverage ... diagram. A corresponding filter is displayed in the analysis header.
You can select one or more individual deviations in the Deviations list. In the drop-down menu, you can select the deviation type to filter the list. By default, all individual deviations are shown. For a quick check, the special Deviation filter type is created and displayed in the analysis header.
Example
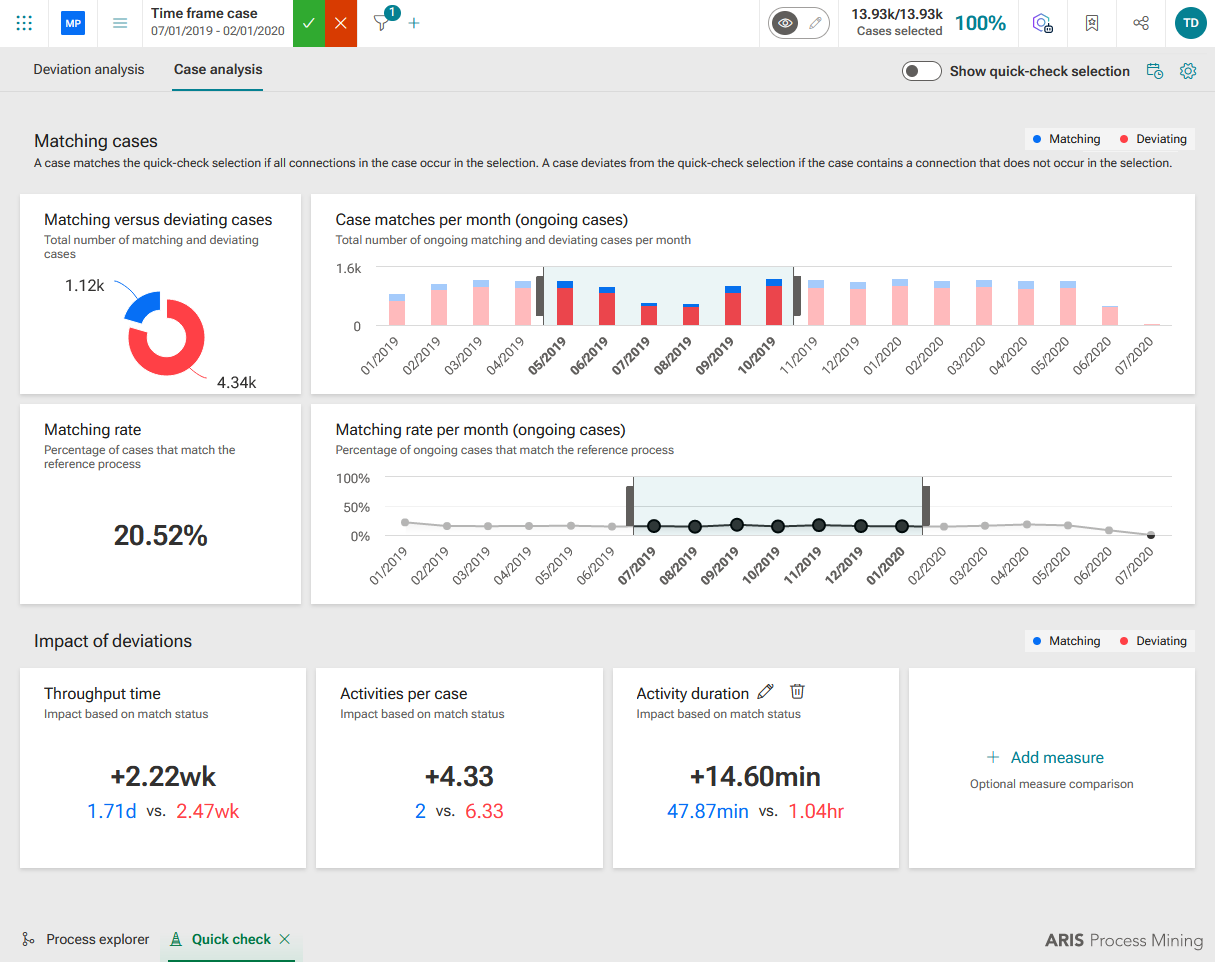
On the Case analysis tab, you can specify various filters and add other measures to the analysis.
You can specify time ranges as filters in the Case matches ... and Matching rate ... diagrams. Corresponding filters are displayed in the analysis header.
To add measures to the analysis, click + Add measure. The Model panel opens. Select a measure and aggregation type. You can also edit (
 ) and delete (
 ) the custom measures.
The selected measure is added to the Impact of deviations section.
Example
To additionally show the quick-check selection in the Quick-check app, enable the Show quick-check selection option.
Example
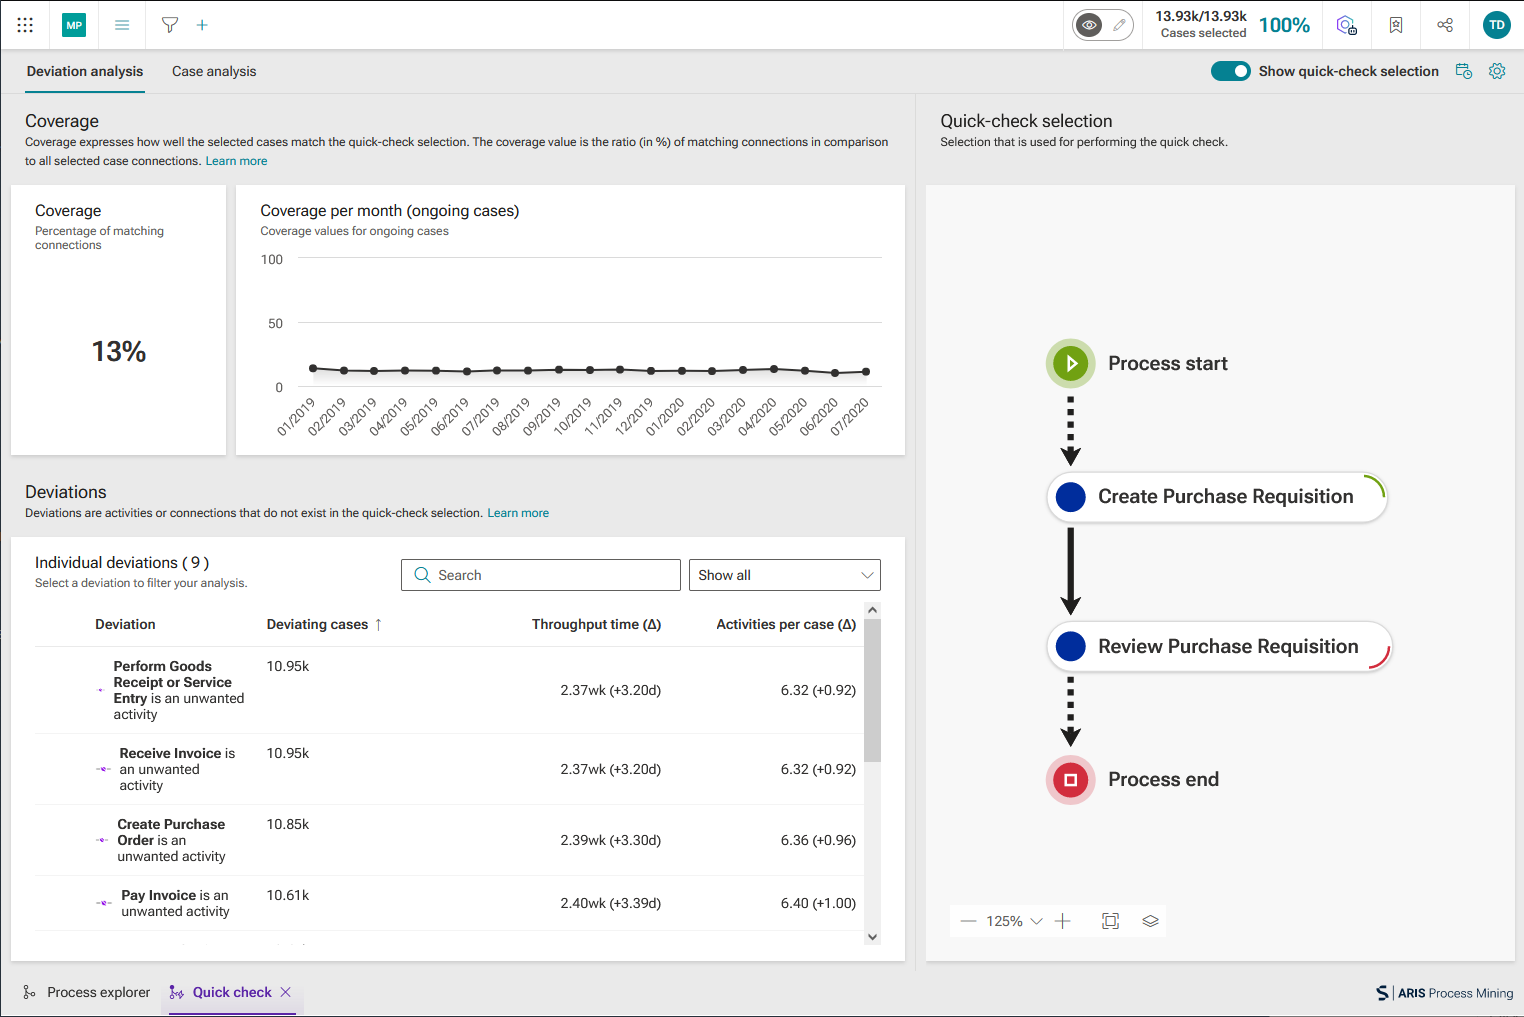
You can change the time frame to filter the data to analyze.
Click the
 Time frame icon. The Select time frame panel opens.
Select a predefined time frame, such as This week or Previous month.
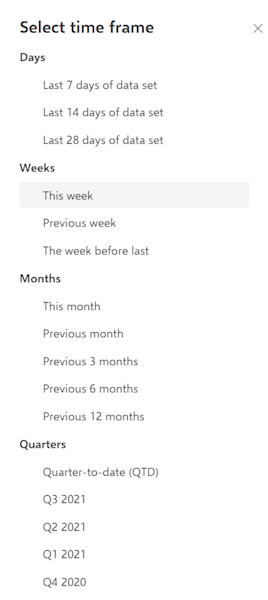
You can select the time dimension and time scale for graphs and enable automatic scaling for the coverage value.
Click the
 Options icon. The Options panel opens.
In the Time dimension for graphs drop-down menu, you can select whether you want to analyze ongoing or started cases. Started cases are cases whose start time is in the time period under consideration. Ongoing cases are cases that have not yet been completed in the considered period.
For example, if the considered period is January, the started cases are all cases that were started in January. Ongoing cases are all cases that are not yet completed in January.
In the Time scale for graphs drop-down menu, you can set the scaling of the period displayed in the charts. The default time scale is Month.
To enable automatic scaling of the coverage value displayed on the Y-axis, enable the Auto-scale y-axis option.
To set your settings as default, click Set as default. The option is available only if one of the options has been changed.
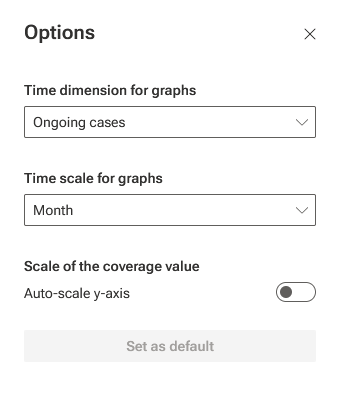
You can save your quick-check selection as a bookmark. To do this, enable Temporary app (Quick-Check) in the Save drop-down menu in the Create bookmark dialog. For details on how to use bookmarks, see the Use bookmarks chapter.
Example
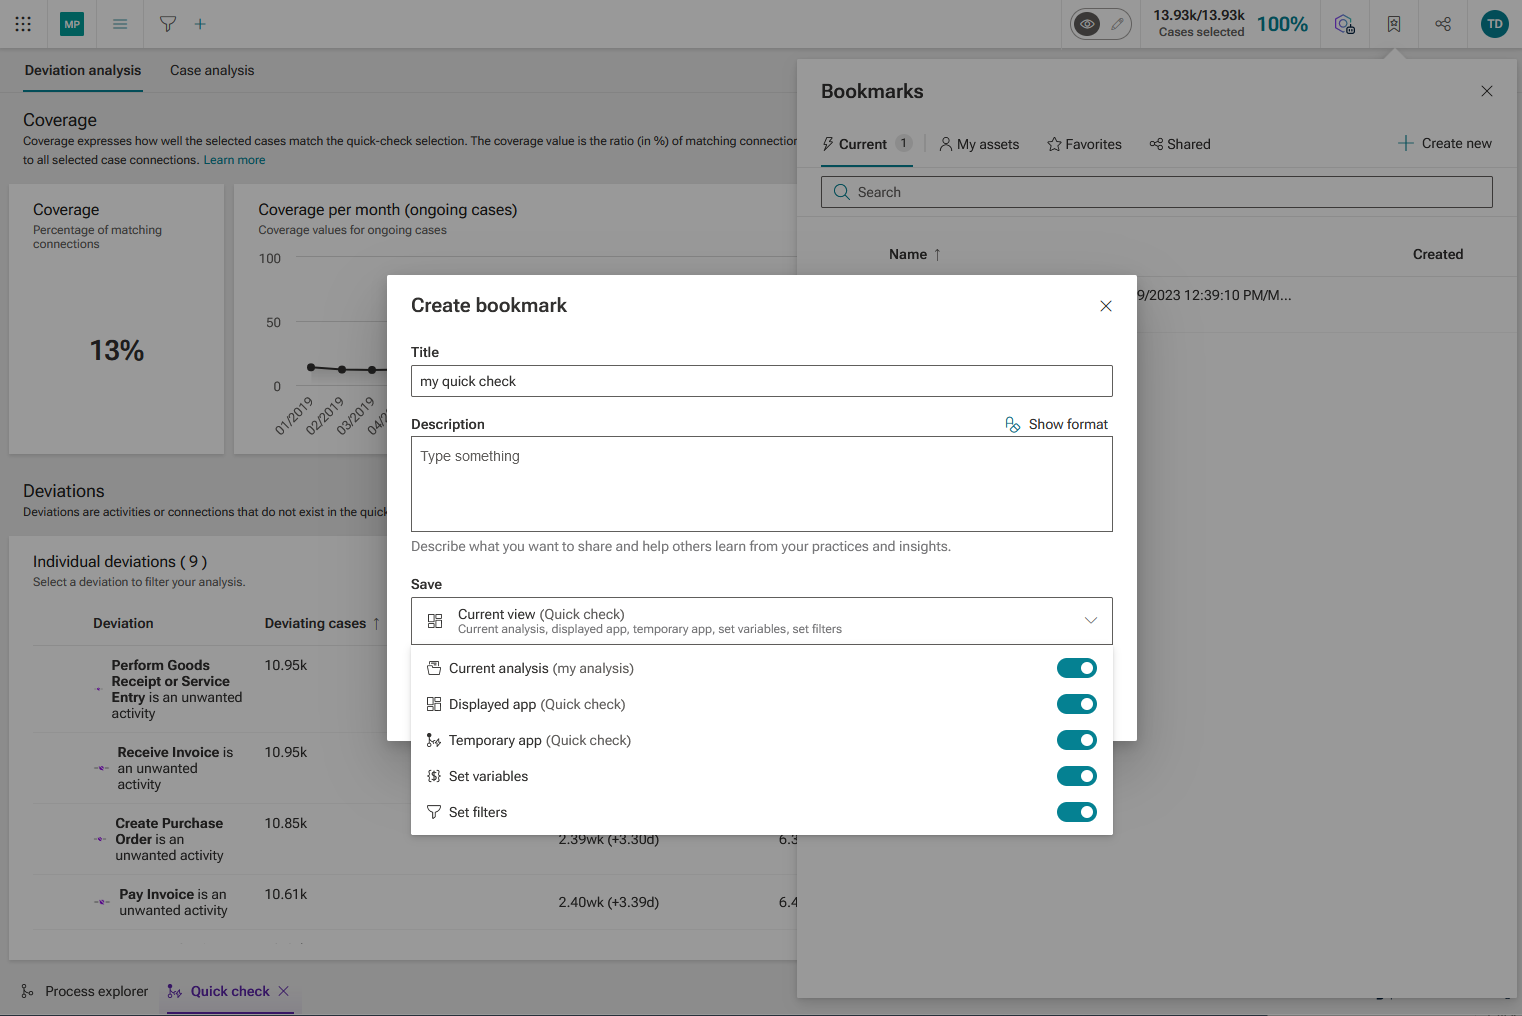
You performed a process quick check.