Select a measure to analyze
You can select a measure to be analyzed in the Process explorer app. The  Case frequency measure is initially selected by default.
To display the Activity frequency measure instead the Case frequency measure, click the Number drop-down menu and select Activity frequency.
To analyze the Throughput time measure, click the
 Throughput time icon, and then select an aggregation type in the corresponding drop-down menu.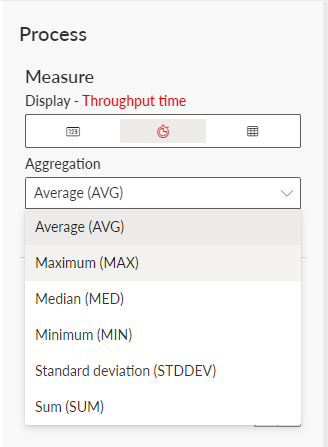
You can also analyze any other available measure.
Click the
 Measure icon.
Click the
 Change custom measure icon. The Model panel opens. The Model panel provides all measures available for the analysis. Select a measure and click Done.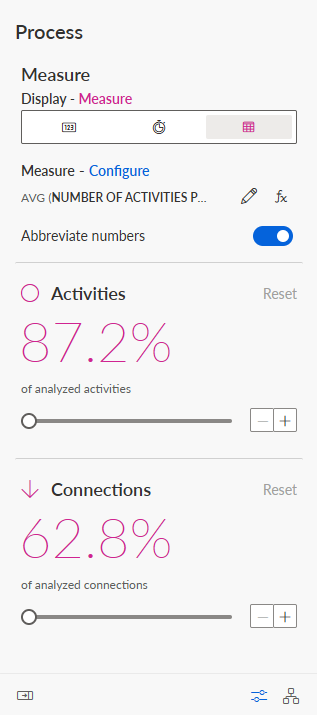
To specify an aggregation for the measure values, click the
 Edit aggregation icon and select an aggregation. The Select aggregation panel opens. The available aggregations depend on the selected measure. By default, the average values (AVG) is preselected. Click Done.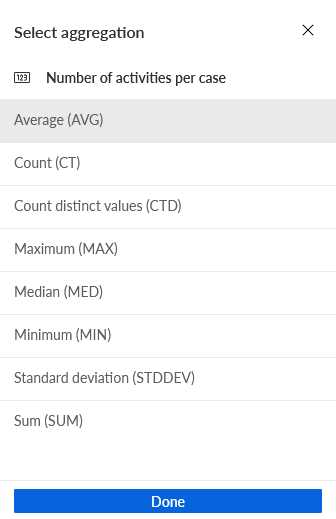
You can specify where you want to display the measure values. If you select a case measure, you can display the values only at the activities, or only at the connections, or at both elements. If you select an activity measure, the values are displayed only at the activities.
Click Configure and select the appropriate option in the Select display mode panel. Click Done.
You can configure the format of the measure values displayed in the chart.
You have configured the measures displayed in the Process explorer.
You can create new calculated fields to use as additional analysis criteria in the Process explorer.