Use the Process overview app
The Process overview app provides basic information and historical progress about your process data. It quickly gives a first impression of the process data and points out interesting aspects for further analysis. The app shows different aspects of your process data using different chart types. For example, it shows the development of the throughput time over a certain time period in a trend diagram.
Depending on the chart type, you have various options for setting filters or specifying the data scaling.
The Process overview app is a predefined app and provided by default. For details on adding the Process overview app to an analysis, see the chapter Add an app to an analysis.
The Process overview app consists of the two sections Key metrics and Throughput time.
Key metrics
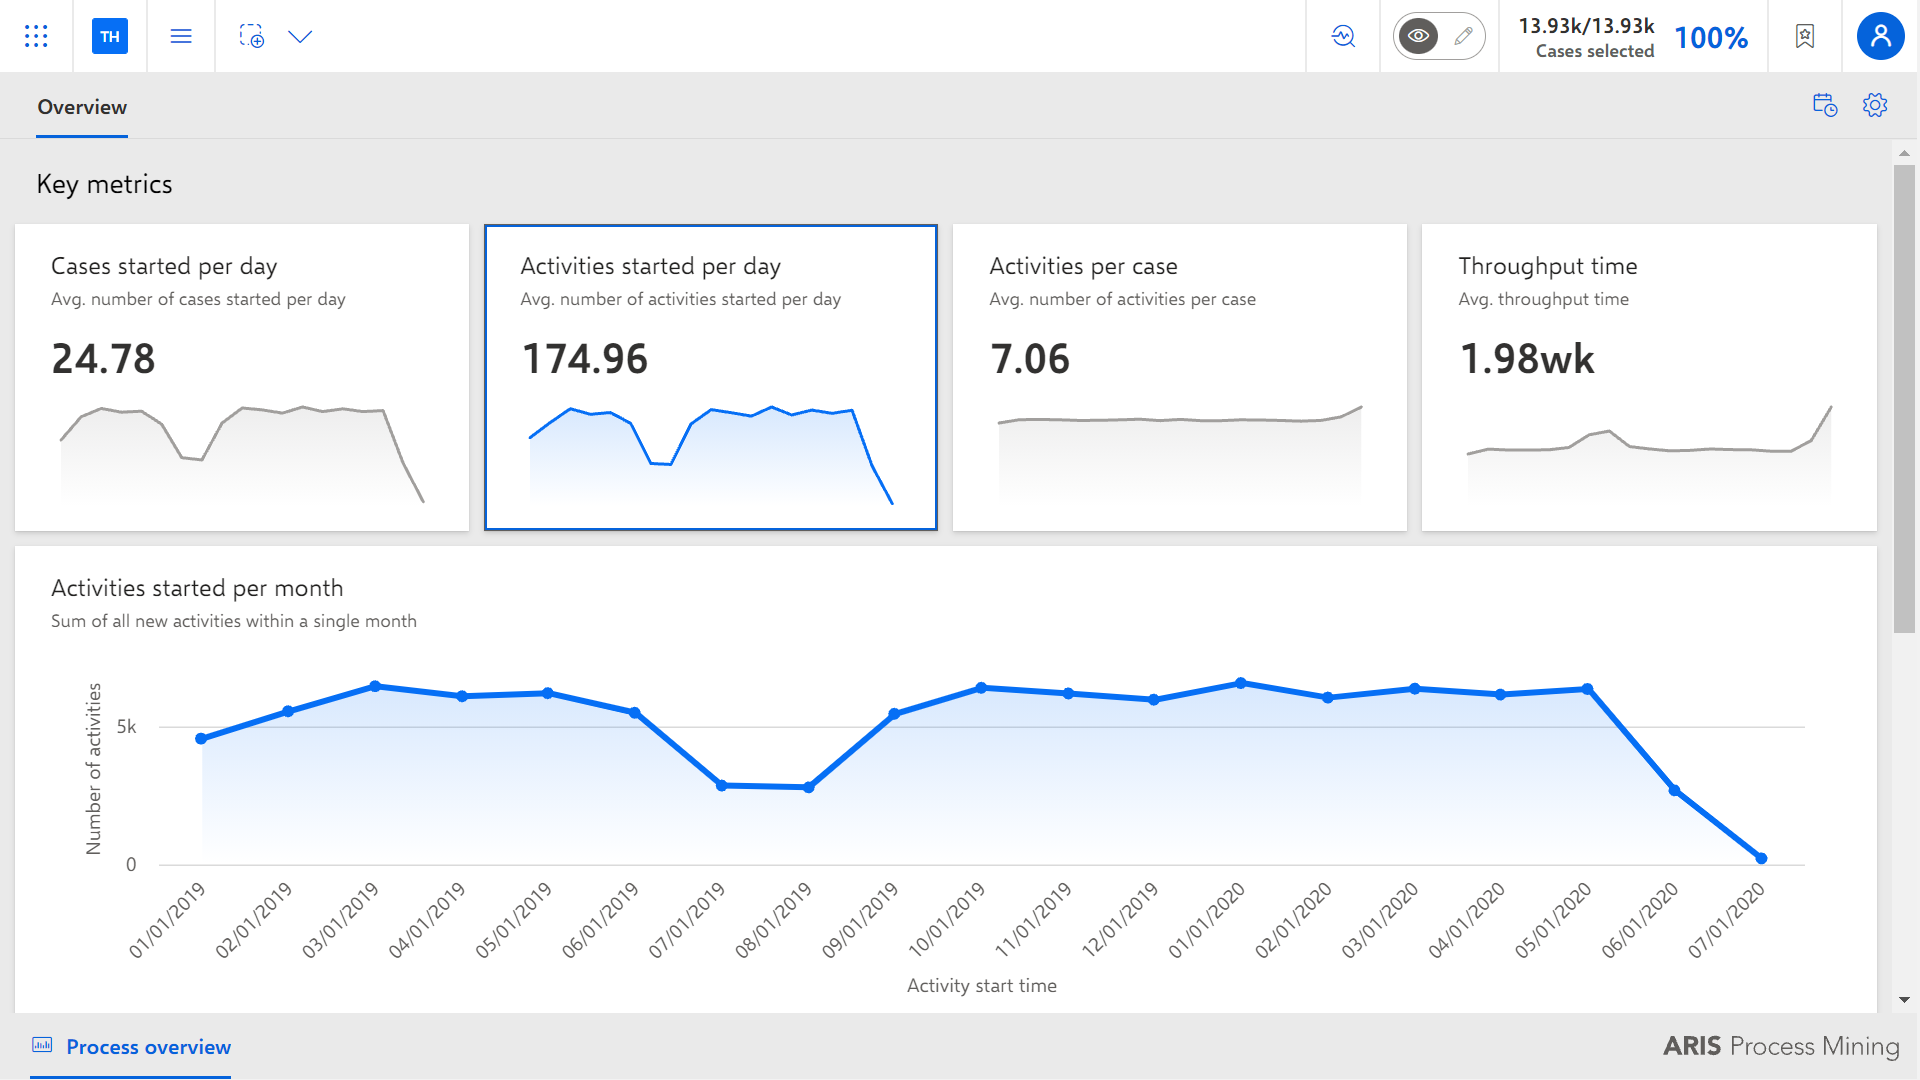
The Key metrics section provides selectable trend charts for the measures Cases started per day, Activities started per day, Activities per case, and Throughput time. The additional trend diagram shows the values of the selected measure with a different adjustable temporal scaling.
Cases started per day - Average number of cases that were started each day
Activities started per day - Average number of activities that were started each day
Activities per case - Average number of activities per case
Throughput time - Average case duration per case
Throughput time
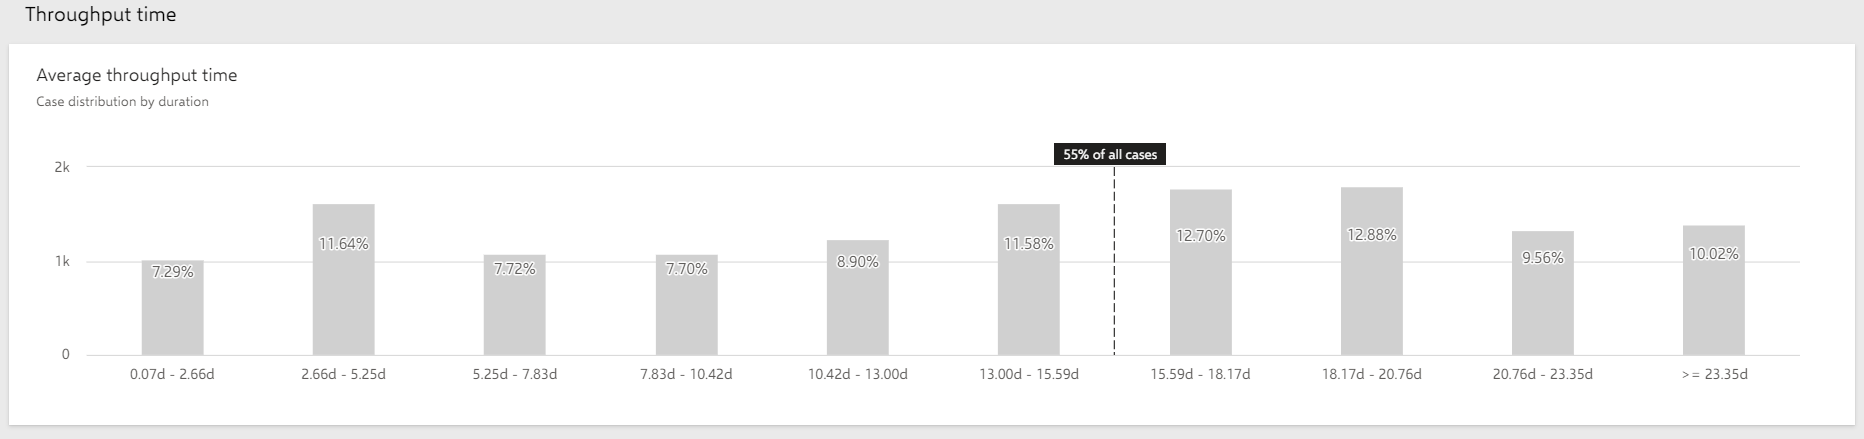
The Throughput time section provides the Average throughput time chart that shows the distribution of all considered cases by Case duration. The column chart shows ten columns where each column contains all cases that have their case duration in a certain range. This range is determined automatically based on the considered cases using the following constraints:
The tenth column represents the cases with longest case duration and contains at least 10% of all considered cases.
The first nine columns represent the remaining cases with shorter case duration. Each column has a range of the same size.
A vertical separator line separates the slower cases of the process data. The sum of the slower cases on the left side of the line represents at least 50% of all cases. That ratio is displayed on top of this vertical separator line.
Click the
 Navigation menu icon in the program header.
Select Projects. The Project panel opens.
Select a project from the list in the Project panel. The recently opened project is preselected in the panel by default.
Click the header of the Project panel. A list of available projects is displayed.
Select a project from the list.
Move the mouse pointer over an analysis in the Project panel.
Click
 Add new app. A selection of available apps is provided.
Select the Process overview app.
The analysis opens with the Process overview app.
Select the aspect that you want to analyze.
The trend chart shows the corresponding analysis of the selected aspect.
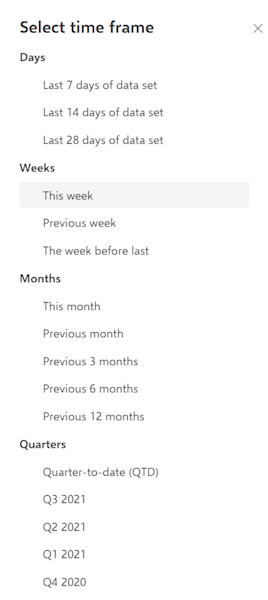
You can change the time frame to filter the data to be analyzed.
Click the
 Time frame icon. The Select time frame panel opens.
Select a predefined time frame, such as This week or Previous month.
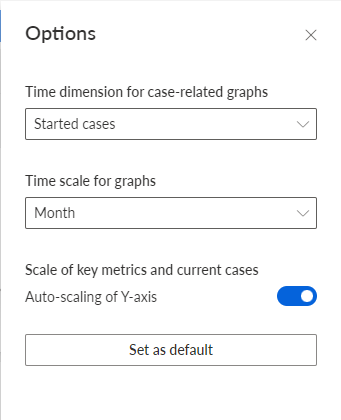
You can select the time dimension for case-related graphs, the time scale for graphs, and enable automatic scaling for key metrics and current cases.
Click the
 Options icon. The Options panel opens.
In the Time dimension for case-related graphs drop down-menu, you can select whether you want to analyze ongoing or started cases. Started cases are cases whose start time is in the time period under consideration. Ongoing cases are cases that have not yet been completed in the considered period.
For example, if the considered period is January, the started cases are all cases that were started in January. Ongoing cases are all cases that are not yet completed in January.
In the Time scale for graphs drop-down menu, you can set the scaling of the period displayed in the charts. The default time scale is Month.
To enable automatic scaling of the values displayed on the Y-axis, enable the Auto-scaling of Y-axis option.
To set your settings as default, click Set as default. The option is available only if one of the options has been changed.
Your settings are applied.